Bitcoin defends support at $96k: Can BTC target $105k next?

![]()
Journalist
Posted: December 12, 2024
Share this article
- Bitcoin bulls have defended the short-term mid-range support.
- There has been increased spot selling over the past couple of days, but it might not be enough to pull prices lower.
Bitcoin [BTC] has formed a range beneath $100k and struggled to break the key psychological level. This range extended from $92.1k to $99.5k.
The Bitcoin mid-range support has been defended despite repeated tests over the past three days, and a rebound appeared likely.
Bitcoin bulls push prices above $95.8k support
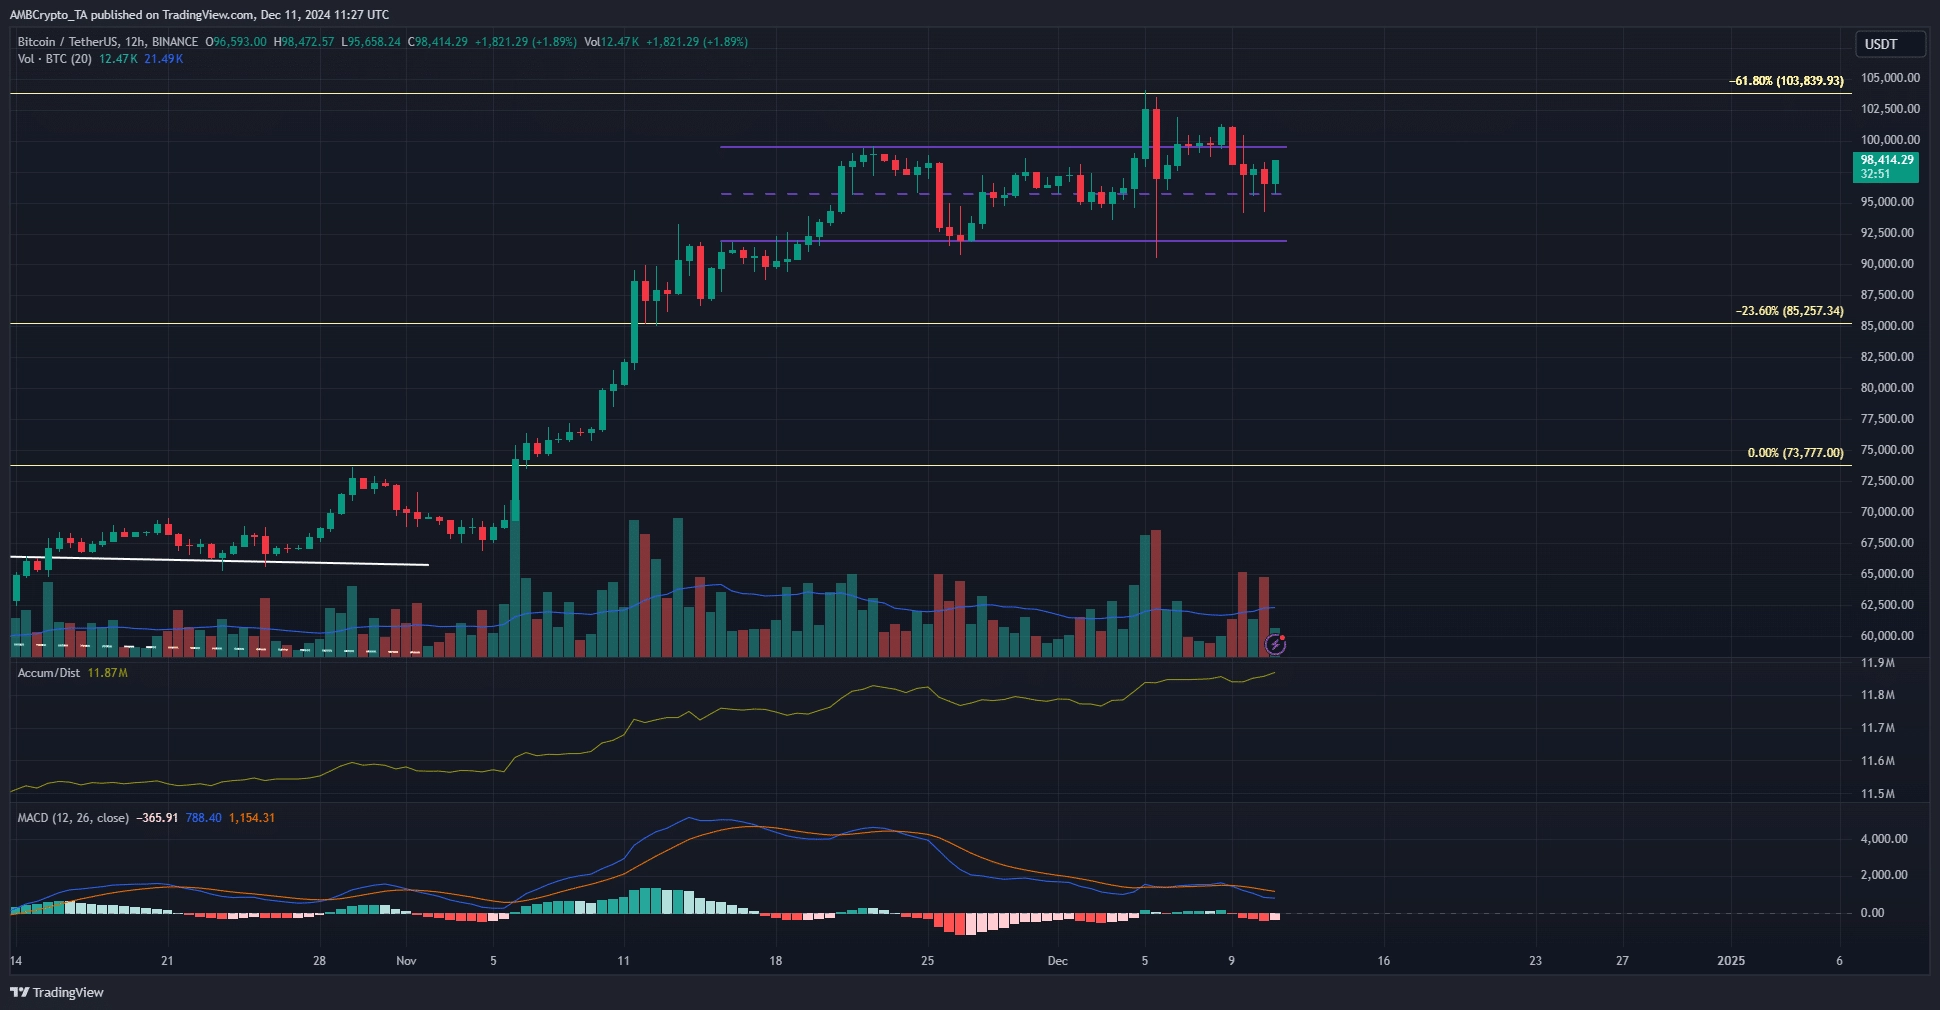
Source: BTC/USDT on TradingView
Bitcoin defended the mid-range support at $95.8k over the past three days. It has not closed a 12-hour session below the mid-range level. Moreover, the A/D indicator has been trending higher this week.
This was a strong sign that buyers were eager to add Bitcoin to their holdings near the mid-range support. It is possible that volatility could take BTC to the short-term lows at $94.5k. This could come about due to a liquidity hunt.
The MACD was bearish on the 12-hour timeframe. Even though it was above zero, it signaled waning bullish momentum. The trading volume has slowly trended downward during BTC’s consolidation within this three-week range.
Falling Open Interest showed sentiment was lukewarm
The spot CVD was on a downtrend even though the bulls defended the mid-range support. Although this went against the findings from the A/D indicator, the timeframes were different. The past couple of days have seen increased selling, but the buyers were stronger over the past week.
Alongside the falling short-term spot demand, the Open Interest(OI) has also slid lower. This generally happens when an asset stops its strong trend, which Bitcoin has done by forming a range.
The falling OI indicated speculators were waiting for the market to make up its mind and break the range.
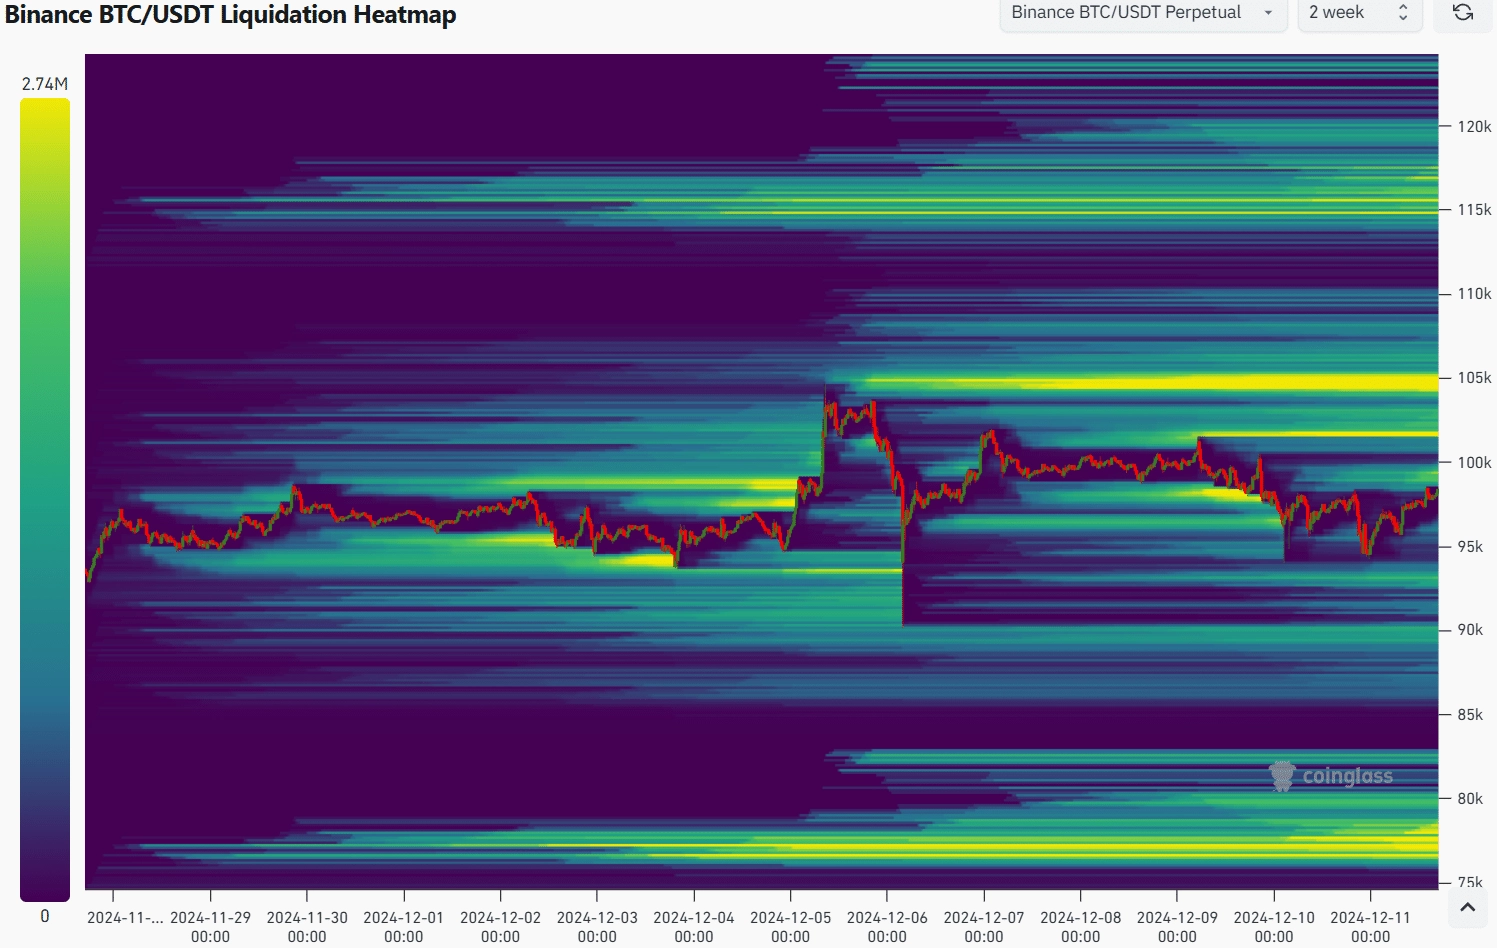
Source: Coinglass
Earlier, it was mentioned that a liquidity hunt could drive Bitcoin to the $94.5k support. The liquidation chart showed that, while this was possible, a price move higher to $105k was much more likely.
Read Bitcoin’s [BTC] Price Prediction 2024-25
The liquidity cluster at $105k was intense, and the BTC consolidation around $100k built this liquidity. It is highly likely that Bitcoin will visit these highs in the coming days, and potentially break beyond it.
Disclaimer: The information presented does not constitute financial, investment, trading, or other types of advice and is solely the writer’s opinion
Share