Is ORDI Price Ready For A Breakout Run To $70?

Amid the crypto market staggering to reclaim recovering momentum, ORDI price witnesses a 98.17% surge in trading volume to hit $166M. The surge in trading activity over the past 24 hours bolsters the recovery of 15.40%.
However, the overall trend in the last few months has been bearish, forming a falling wedge in the daily chart. Will a bull cycle in ORDI result in a breakout run this month?
ORDI Price Prediction
In the daily chart, the ORDI price shows a declining trend, accounting for a 68% drop from the annual high of $96.53. Furthermore, the declining trend breaks under the $50 psychological mark and tests a low of $23.51.
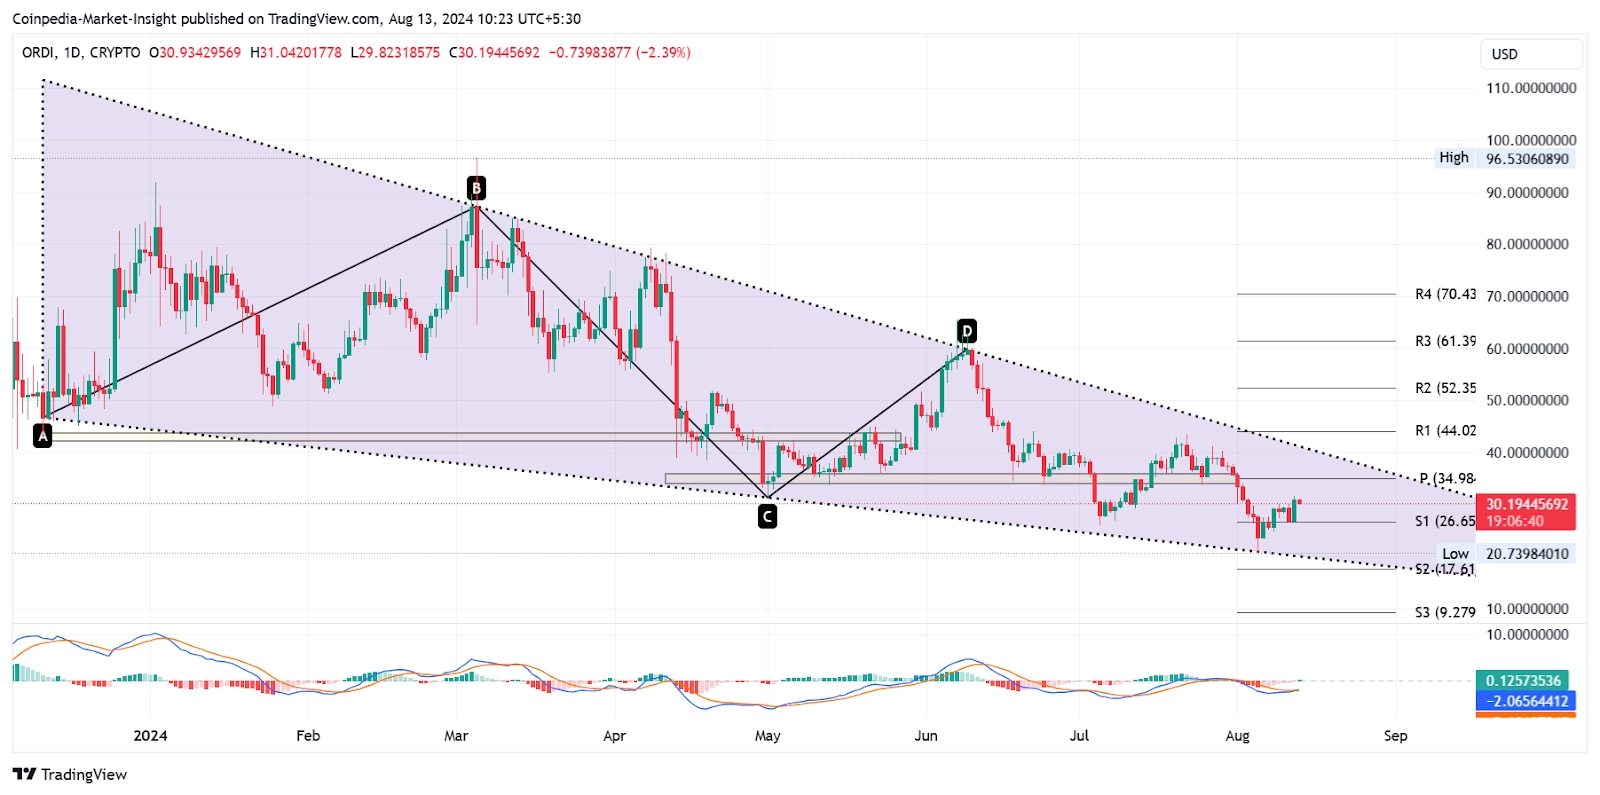
Source – Tradingview
The ongoing bull cycle in the falling wedge accounts for a price jump of 43% in just 8 days. Currently, the ORDI price trades at $30.11, with an intraday pullback of 2.66% following last night’s jump of 15.40%.
Based on the general assumption of a falling wedge, the asset price leads to a bullish breakout run. Hence, the chances of an uptrend reversal rally in the ORDI price are increasing.
Despite a 61% YTD drop, the altcoin has a market cap of $632 million, ranking at #92 in the crypto market. As the broader market recovers, ORDI price teases a bullish breakout run for a massive trend reversal.
Technical Indicators:
MACD: The bullish reversal in the falling wedge pattern results in an uptick in the MACD and signal lines. The average lines are on the verge of a bullish crossover, supporting the bull cycle.
Will ORDI Surpass $50?
As per the Pivot points standard, the upside targets are at $34, $44, $52, $61, and $70. Hence, the recovering rally in ORDI price shows an upside potential of 130%. However, the bullish breakout of the overhead trendline will be critical in redirecting the trend momentum.
On the downside, the pivot points reveal support levels at $26,$17, and $9.
Was this writing helpful?
No Yes