![]()
contributor
Share this article
- 73.5% of top Binance traders hold long positions, while 26.5% hold short positions.
- If SOL doesn’t gain momentum, it could lose its fourth spot to Ripple’s native token, XRP.
Solana [SOL], the world’s fourth-largest cryptocurrency by market cap, is consolidating within a tight range and has formed a bearish price action pattern.
Meanwhile, altcoins like Ethereum [ETH] and Ripple [XRP] are showing strong bullish momentum. This raises concerns among SOL holders about its ability to maintain its position.
According to CoinMarketCap, Solana’s market cap has remained at $114.4 billion despite its sideways movement over the past two weeks. In contrast, during the same period, XRP experienced an 80% upward momentum, raising its market cap to $106.5 billion.
Strong participation of whales
Data from the on-chain analytics firm Coinglass indicates that, despite SOL’s price remaining in a consolidation zone, long-term holders have shown strong interest in the asset.
Coinglass’s SOL Spot Inflow/Outflow metrics indicate that SOL has seen significant outflows of $182.5 million from exchanges since the 23rd of November 2024.
This substantial outflow suggests that whales and long-term holders have withdrawn these tokens from exchanges to their wallets, indicating accumulation.

Source: Coinglass
The crypto community often views exchange outflows as a positive sign, signaling a potential buying opportunity and upward momentum.
Traders’ recent activity
In addition to long-term holders, traders have also shown strong interest and confidence in the token, as reported by Coinglass. At the time of writing, the Binance SOLUSDT Long/Short ratio stood at 2.77, indicating strong bullish sentiment among traders.

Source: Coinglass
Currently, 73.5% of top Binance traders hold long positions, while 26.5% hold short positions.
The combination of these on-chain metrics with technical analysis suggests that bulls are currently dominating the asset and may be attempting to keep SOL in its fourth position.
Solana’s technical analysis and key levels
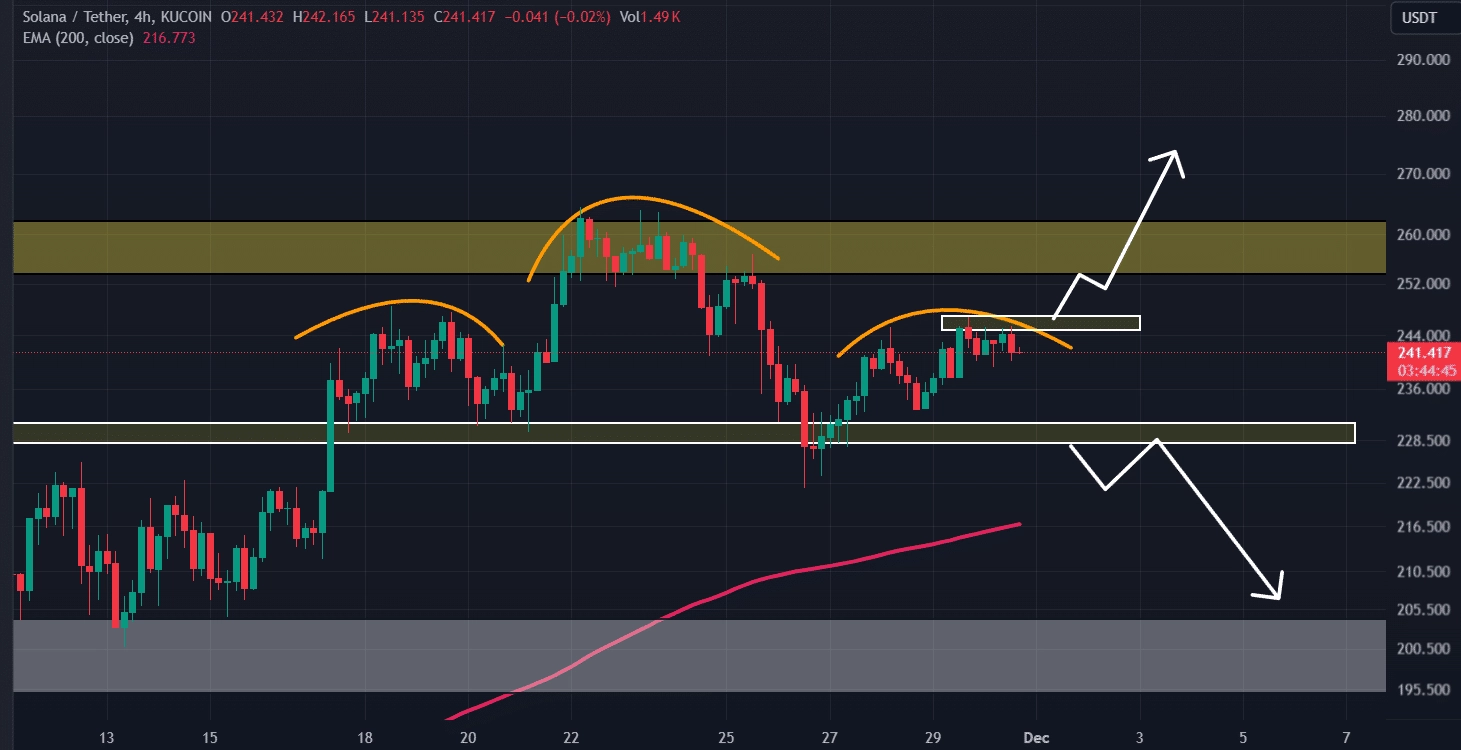
According to AMBCrypto’s technical analysis, Solana seems to be forming a bearish head-and-shoulder pattern on a four-hour chart. Currently, this pattern is incomplete as the second shoulder is still developing.
If SOL completes this pattern and breaks its neckline at $230, it could potentially fall to the $200 level.

Source: TradingView
Conversely, if SOL closes four consecutive candles above the $245 level, this bearish outlook may end, and we could see a new high.
On the positive side, Solana’s Relative Strength Index (RSI) indicated a potential for an upside rally in the coming days. With an RSI of 51, it remained below the overbought area, suggesting there is still room for growth.
Read Solana’s [SOL] Price Prediction 2024–2025
At press time, SOL was trading near $242 and has experienced a price decline of over 1.25% in the past 24 hours.
During the same period, its volume jumped by 14.56%, indicating heightened participation from traders and investors compared to previous days.


