- Cardano price dropped 3.7% in 24 hours but held support above $0.70 level
- Technical analysts note ADA bounced off its 50-month moving average, showing strong long-term support
- Falling wedge patterns on charts mirror previous cycles that led to breakouts
- Current structure suggests potential for bullish phase despite recent decline
- Trading volume decreased 10% to $1.96 billion, indicating reduced market participation
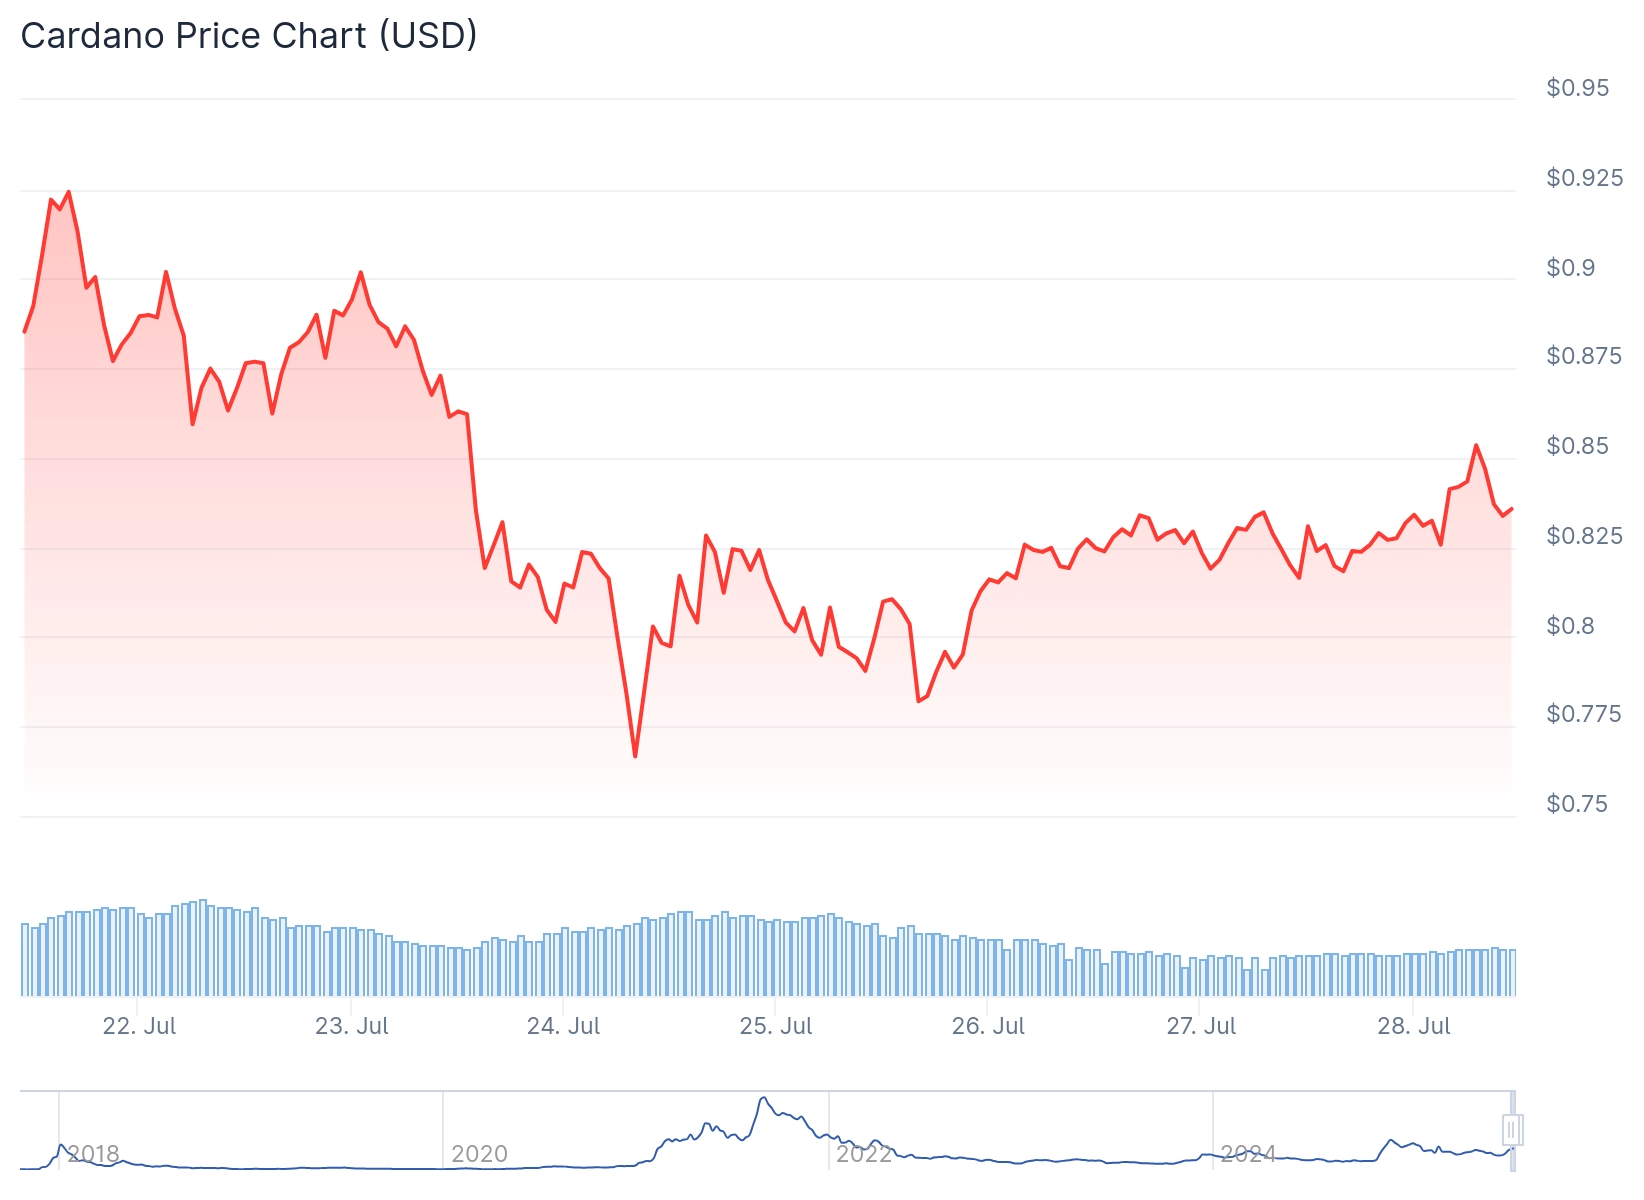
Cardano price fell over 3.7% in the last 24 hours, dropping from a daily high of $0.86 to trade near $0.80. The altcoin hit an intraday low near $0.770 before recovering slightly.
 Cardano (ADA) Price
At press time, ADA was trading at $0.8006 with the recent decline following broader market pressure. Trading volume decreased about 10% to $1.96 billion, suggesting reduced participation from both buyers and sellers.
Despite the correction, ADA price held firm above the $0.77 level. This zone has acted as a base during extended consolidations in previous market cycles.
Cardano maintained its position as the 10th largest cryptocurrency by market capitalization. The recent price action has triggered speculation about the next directional move.
Technical analysts have identified several bullish indicators despite the recent decline. The price structure shows similarities to previous market cycles that preceded major rallies.
Long-Term Support Levels Hold Strong
Technical analysis by TrendRidersTR shows Cardano price bounced off its 50-month moving average. This represents a key support line for long-term investors.

Assets with price action above such moving averages often form accumulation zones. These areas typically develop strength before pushing prices upward.
The bounce from this moving average suggests long-term holders remain active. The retest of this zone followed by a price rebound provides structural confirmation.
The range between $0.70 and $0.80 may continue serving as support for the current market cycle. Analysts noted Cardano may sustain prices above this average in coming weeks.
Historical data shows similar bounces from this technical level have preceded periods of price appreciation. The current bounce follows the same pattern as previous cycles.
Historical Patterns Point to Potential Breakout
Analyst Javon Marks identified repeating falling wedge patterns on Cardanos long-term chart. These structures typically appear during market corrections.
Falling wedges are often attributed to trend reversals when prices break above the upper resistance line. ADA has formed such patterns in multiple previous cycles.
Each historical wedge formation was followed by a rally phase. The chart shows a repeating pattern of wedge formation, breakout, and subsequent price surge.
The latest falling wedge pattern follows the same technical development as previous rallies. Early signs of a potential breakout have already appeared.
The structure remained intact despite the recent price drop. This suggests short-term volatility may be absorbed rather than trigger panic selling.
If Cardano continues building support above $0.75, analysts project next resistance levels between $0.88 and $1.00. These targets align with historical breakout patterns.
Another analyst, BitMonty, identified a descending wedge shape on the 4-hour chart. This classical bullish reversal formation often signals potential upside breakouts.
If validated by price action, the breakout could ignite a fresh upward trend. Target levels include $0.9047, $0.9454, and $0.9783 based on technical projections.
An ADA/USDT chart shows Cardano pulling back from upper resistance of a rising channel pattern. After testing highs near $0.95, ADA retraced to trade near its 50-period SMA.
Analyst Sebastian marked the range around $0.7 as a potential bounce zone near ascending trendline support. While ADA reached this target zone, the bounce appeared relatively weak.
RSI dipped near 40 and failed to confirm bullish divergence on shorter timeframes. The volume spike during the recent drop signals selling pressure without clear reversal formation yet.
Current trading shows ADA gained 2.45% in the last 24 hours to $0.8270, though trading volume fell 36.91% to $911.52 million according to recent data.