Strict editorial policy that focuses on accuracy, relevance, and impartiality
Created by industry experts and meticulously reviewed
The highest standards in reporting and publishing
Strict editorial policy that focuses on accuracy, relevance, and impartiality
Morbi pretium leo et nisl aliquam mollis. Quisque arcu lorem, ultricies quis pellentesque nec, ullamcorper eu odio.
In his latest macro-technical analysis, crypto strategist Kevin (@Kev_Capital_TA) has flagged a potentially pivotal moment for Ethereum (ETH), arguing that a confluence of rare monthly chart signalssome not seen in yearscould be laying the groundwork for durable altcoin outperformance. Speaking in a video posted June 9, the analyst described the current Ethereum setup across multiple timeframes as something weve never seen before, drawing comparisons to historical signals that preceded major rallies in 2016, 2018, and 2020.
Ethereum Primed For Macro Breakout
Kevin emphasized that Ethereum now exhibits strong bullish momentum across its USD pair, dominance chart, and ETH/BTC ratio, pointing to a simultaneous alignment of several high-time frame indicators. These are things that just dont pop up every day, he said. Matter of fact, these are things that have almost never popped up in such confluence throughout history for Ethereum.
The core of Kevins thesis hinges on what he calls a monthly demand candlea large, typically green candlestick that emerges after a protracted correction. Ethereum printed such a candle in May 2025 following nearly a year of sideways chop and five months of drawdown. Historically, these demand candles have marked the start of significant uptrends. Kevin cited analogous structures in 2016, 2018, and during the COVID-19 crash in 2020, all of which preceded multi-month rallies.
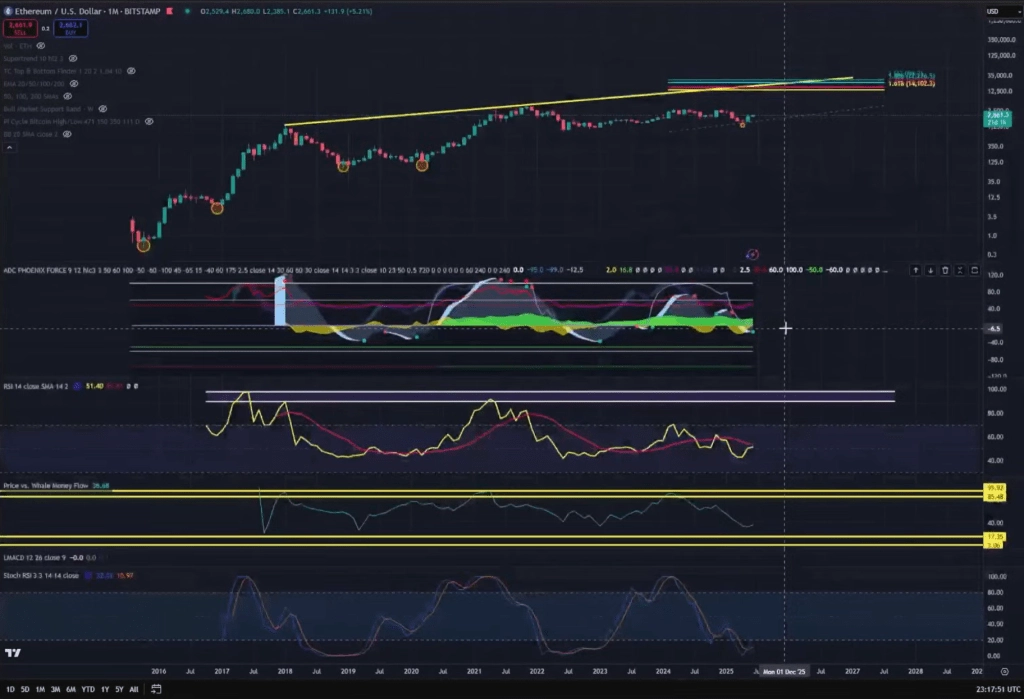 Ethereum price analysis | Source: YouTube @Kev_Capital_TA
This may be the most textbook demand candle weve ever had, he noted, adding that the last time we saw something like this was before ETH ran for nearly a year with barely any major correction.
Supporting the candle analysis is a synchronized bullish turn in several technical indicators. The Market Cipher momentum wave has clipped into the oversold zone and printed a confirmed green dot buy signal. Simultaneously, the VWAPvolume-weighted average pricehas crossed above the zero line, and money flow has started to trend upward. Kevin was explicit about the importance of this configuration: Let me tell you something: this is a big deal.
The monthly RSI, currently sitting at 51, has not yet broken the crucial 70-level that historically marks the onset of parabolic price action. According to Kevin, ETH has never even broken 70 this cycle. You havent seen whats possible yet for Ethereumor for altcoins in general. Youve seen nothing yet.
He also highlighted the return of whale accumulation, measured through a proprietary whale money flow indicator. After exiting ETH positions for over a yearfrom March 2024 to May 2025whale flows have shown a V-shaped bottom and are now turning up. We are now starting to see accumulation durably here, Kevin said. You keep hearing that BlackRocks buying ETH, and I dont know if thats reflected in this indicator, but we are definitely seeing whale activity occur on the monthly time frame.
The analyst went further, showing that Ethereums stock RSI on the monthly timeframe has not only bottomed out but is now rebounding sharplya pattern that historically precedes long-duration uptrends. This is aggressive movement, he explained, noting that for confirmation, the RSI still needs to cross the 20-level, but emphasized that the current shape of the rebound is stronger than in previous cycles.
Ethereum Shows Relative Strength
Another key piece of the puzzle is Ethereums dominance chart, which tracks ETHs market cap relative to the rest of the crypto space excluding Bitcoin. Kevin pointed to a potential double bottom on the monthly chart and a newly confirmed MACD momentum shift, the first in over two years. Thats two years and one month of downtrend finally reversing, he said.
Related Reading: Ethereum Consolidates As Momentum Builds Analyst Has $3K In Sight For June
Finally, the ETH/BTC pair is showing a near-identical structure to Ethereums dominance chart. Kevin believes this confluence is key. Look at thatwow, thats funnyit looks the same. You find your major low right where you found it in 2020. The monthly indicators are all curling up.
Still, he remained measured in his optimism, noting that macroeconomic conditionsparticularly monetary policyremain essential for confirming the bullish case. Its going to take some monetary policy shifting. We still need inflation to come in line. But the market is living four to six months ahead. If the market starts to sniff out that easing is coming, well see that reflected in asset prices before it happens.
Referencing cycle theory and historical post-halving performance, Kevin argued that ETHs recent relative strength fits both narratives. Typically, ETH and altcoins start to outperform Bitcoin in the post-halving year. Were halfway through that windowand it looks like its finally starting.
Looking ahead, he sees Ethereum as the major key that unlocks broad altcoin outperformance. ETH opens the door to soaking up market cap, which will then leak down into mid-caps and small-caps. Everything starts with ETH.
While reiterating that patience is crucial, Kevin concluded with conviction: The monthly timeframe indicators have never been more historically on our side. I think were on the verge of something really big.
At press time, ETH traded at $2,739.
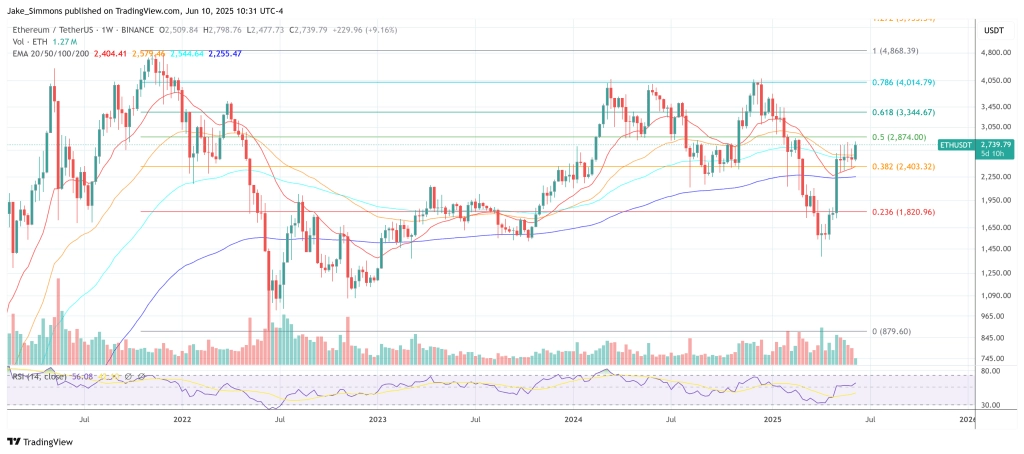 ETH eyes the 0.5 Fib, 1-week chart | Source: ETHUSDT on TradingView.com
Featured image created with DALL.E, chart from TradingView.com