![]() Listen to Article
Listen to Article
This content is provided by a sponsor.
PRESS RELEASE.
Amid growing demand for transparent, fiatbacked stablecoins, Agora is stepping forward with AUSDa nextgeneration digital dollar engineered for seamless, borderless commerce. Built on robust reserves of cash, U.S. Treasury bills, and overnight repo agreements, AUSD delivers the reliability of traditional finance with the reach of blockchain technology.
Our goal is simple: make dollars move at internet speed while meeting the strictest standards of safety and compliance. /Nick/van/Eck, CoFounder &/CEO
Agora: Bridging Trust and Technology
Founded in 2023, U.S.based Agora is on a mission to reduce friction in accessing, transferring, and using the worlds reserve currency. Whether youre an institution settling trades or an individual sending remittances, AUSD offers a fully collateralized, freely tradable alternative to bank wires and volatile crypto assets.
PartnerCentric, ComplianceFirst Design
AUSD isnt just another stablecoinits purposebuilt for regulated use cases:
- Transparent Reserves held in cash and shortduration Treasuries, attested by independent custodians.
- SmartContract Safeguards, such as mintandburn controls and assetfreezing functions, to combat illicit finance.
- Open ERC20 Standard enabling effortless integration with wallets, exchanges, and DeFi protocols.
AUSD and Ethereum: A Resilient Pairing
By launching on Ethereum, Agora taps into the networks mature developer ecosystem and battletested security. From CeFi trading desks to DeFi lending pools, any application that already supports ERC20 tokens can integrate AUSD with minimal friction, unlocking dollar stability for users worldwide.
The Tokenomics of a True Stablecoin
Unlike volatile governance or utility tokens, AUSD is fully redeemable 1:1 for U.S. dollars. Its economic model is elegantly simple:
- 100% Collateralized by highquality, shortterm U.S. assets.
- No Algorithmic Supply Gamesnew AUSD is minted only when fresh collateral is verified; tokens are burned on redemption.
- Transparency Over Speculationvalue stems from the underlying dollars, not token scarcity.
This reservebacked framework prioritizes liquidity and stability, making AUSD a dependable medium of exchange in any market condition.
Whats Next for Agora
While the public roadmap is still under wraps, Agora is actively building:
- Institutional OnRamps with leading exchanges, custodians, and payment processors.
- Global Remittance Corridors that cut transfer costs and settlement times to seconds.
- Multichain Support to extend AUSDs utility beyond Ethereum into emerging L2s and highthroughput networks.
Each step broadens AUSDs reach, ensuring dollars remain the cornerstone of Web3 commerce.
Conclusion: Stability You Can Trust, Utility You Can Feel
AUSD merges timetested monetary backing with the programmability of crypto, positioning itself as a stable foundation for trading, payments, and DeFi innovation. For users seeking a compliant, fully collateralized onchain dollar, Agoras AUSD is the safe harbor in a sea of volatility.
Learn More about Agora AUSD
Website: https://www.agora.finance/
X: https://x.com/withAUSD
_________________________________________________________________________
Bitcoin.com accepts no responsibility or liability, and is not responsible, directly or indirectly, for any damage or loss caused or alleged to be caused by or in connection with the use of or reliance on any content, goods or services mentioned in the article.
Image Credits: Shutterstock, Pixabay, Wiki Commons

The app that pays you to use it!
Read & Earn
12884 views
XRP is currently trading at $2.16, with a market capitalization of $127 billion and a 24-hour trading volume of $1.438 billion. The price has fluctuated between $2.11 and $2.18 over the past day, signaling a tightly constrained range as momentum builds.
XRP
The one-hour chart indicates a short-term recovery trend for XRP, with prices rebounding from $2.11 to $2.17. This upward trajectory is marked by a pattern of higher lows and steady accumulation, suggesting a bullish undertone for intraday movements. Trading volume remains moderate, reinforcing the cautious optimism observed in the price action. Active traders might consider entering long positions on pullbacks to the $2.13$2.14 range with a stop-loss just below $2.11. Profit-taking could be considered near the $2.18$2.20 resistance zone unless a breakout materializes.
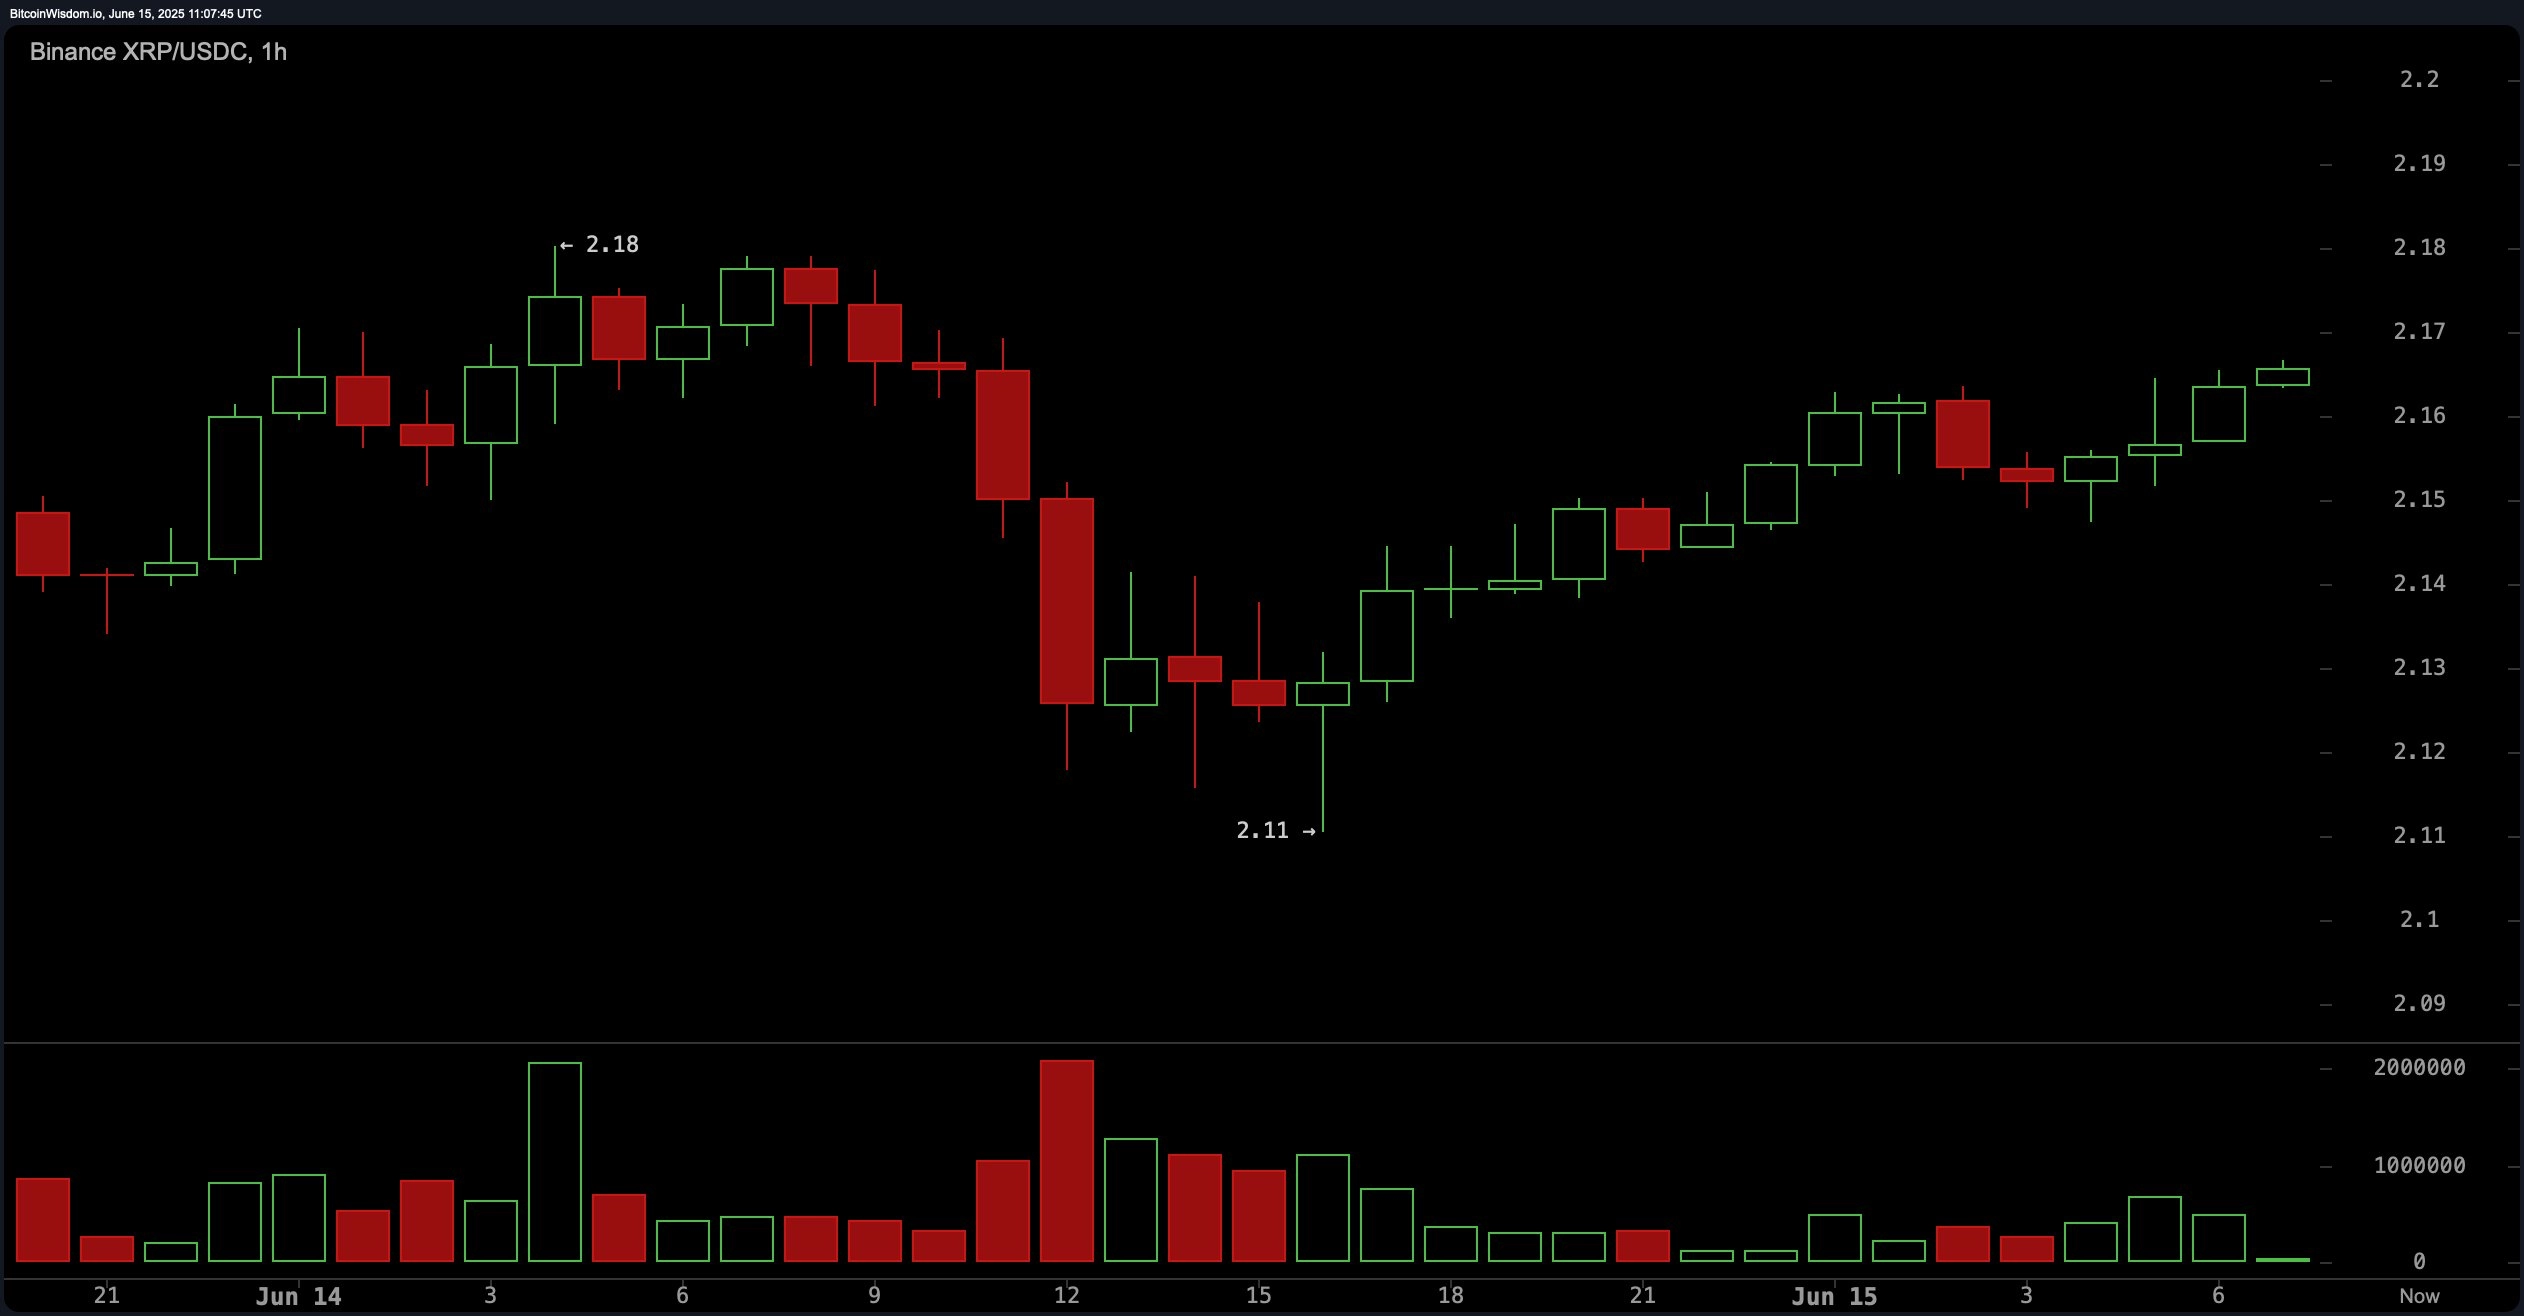 XRP/USDC via Binance on June 15, 2025, 1-hour chart.
The four-hour chart presents a more nuanced picture, having undergone a sharp decline from $2.33 to $2.08 earlier in the week. This drop was accompanied by a significant spike in trading volume, implying strong bearish pressure. Since then, XRP has been consolidating within the $2.10$2.17 range, potentially forming a bear flag or a narrow consolidation band. A decisive move below $2.10 could renew the downtrend, but a breakout above $2.18 with robust volume could signal a bullish reversal. Scalpers might find opportunities on breakouts above key resistance levels, with $2.25 as a potential target.
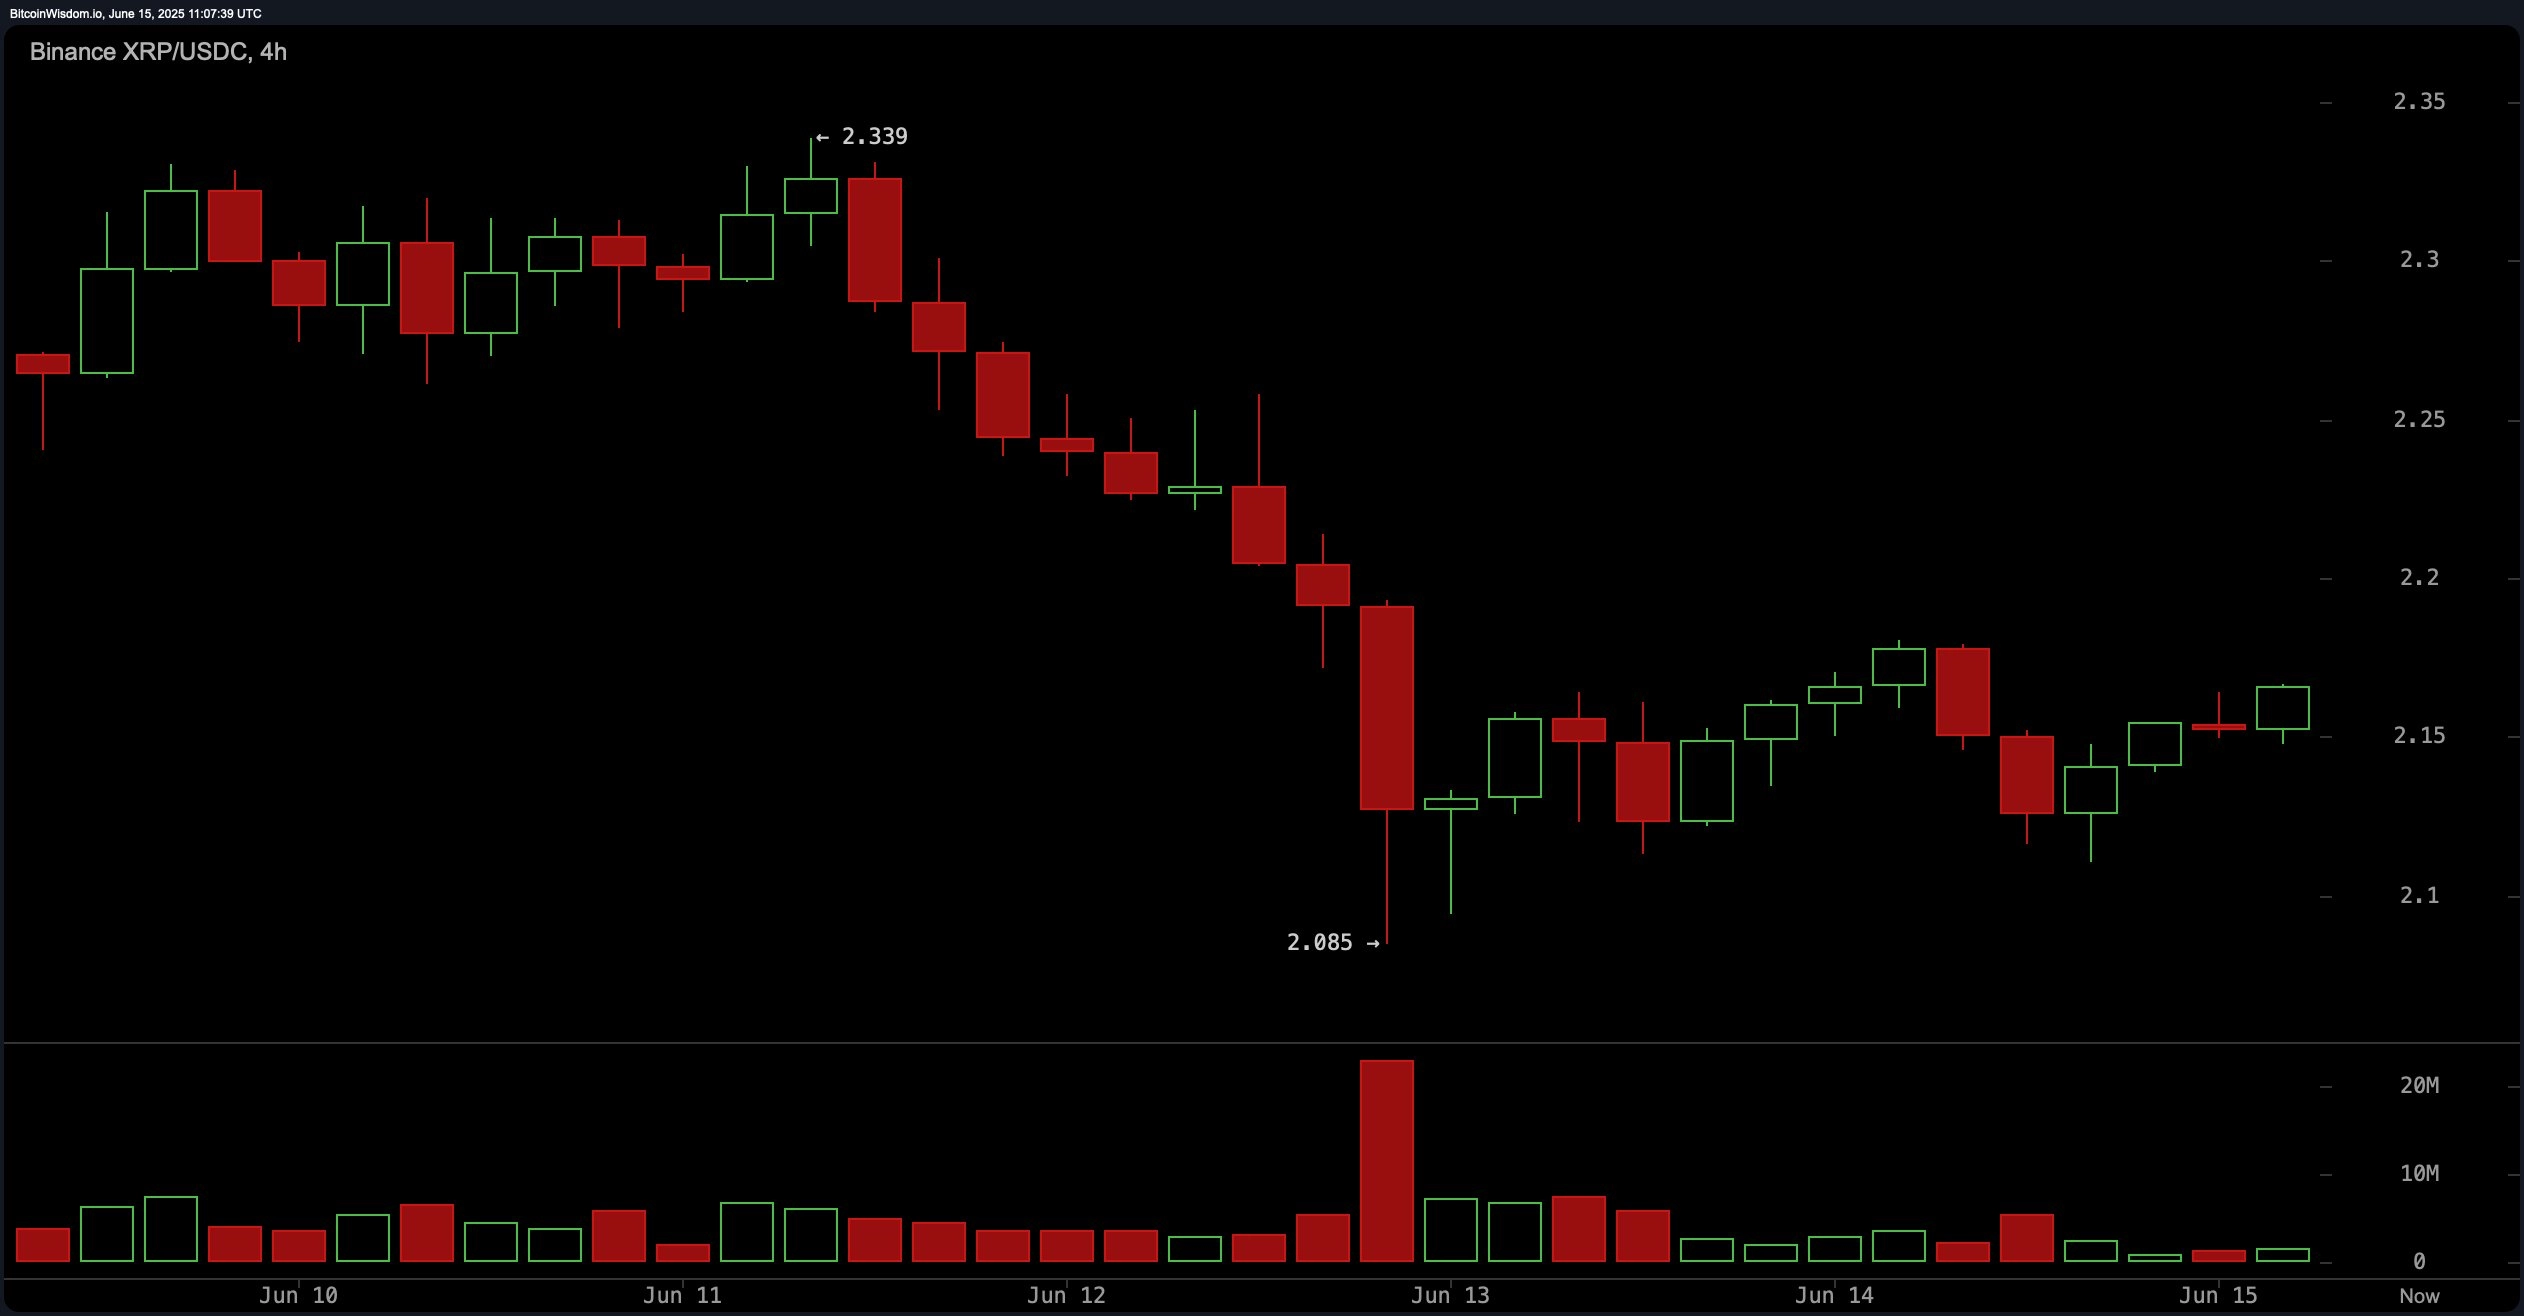 XRP/USDC via Binance on June 15, 2025, 4-hour chart.
On the daily chart, XRP shows a broader downtrend from its recent high of $2.656, with a local bottom appearing near $2.05$2.10. A weak bounce has since emerged, but there is no confirmed bullish reversal yet. The increasing volume accompanying red candles suggests lingering distribution and selling pressure. The critical resistance to watch lies between $2.30 and $2.35, while strong support remains around $2.05. A confirmed higher low followed by a close above $2.20$2.22 could validate a shift in trend, providing a cautious long entry for swing traders.
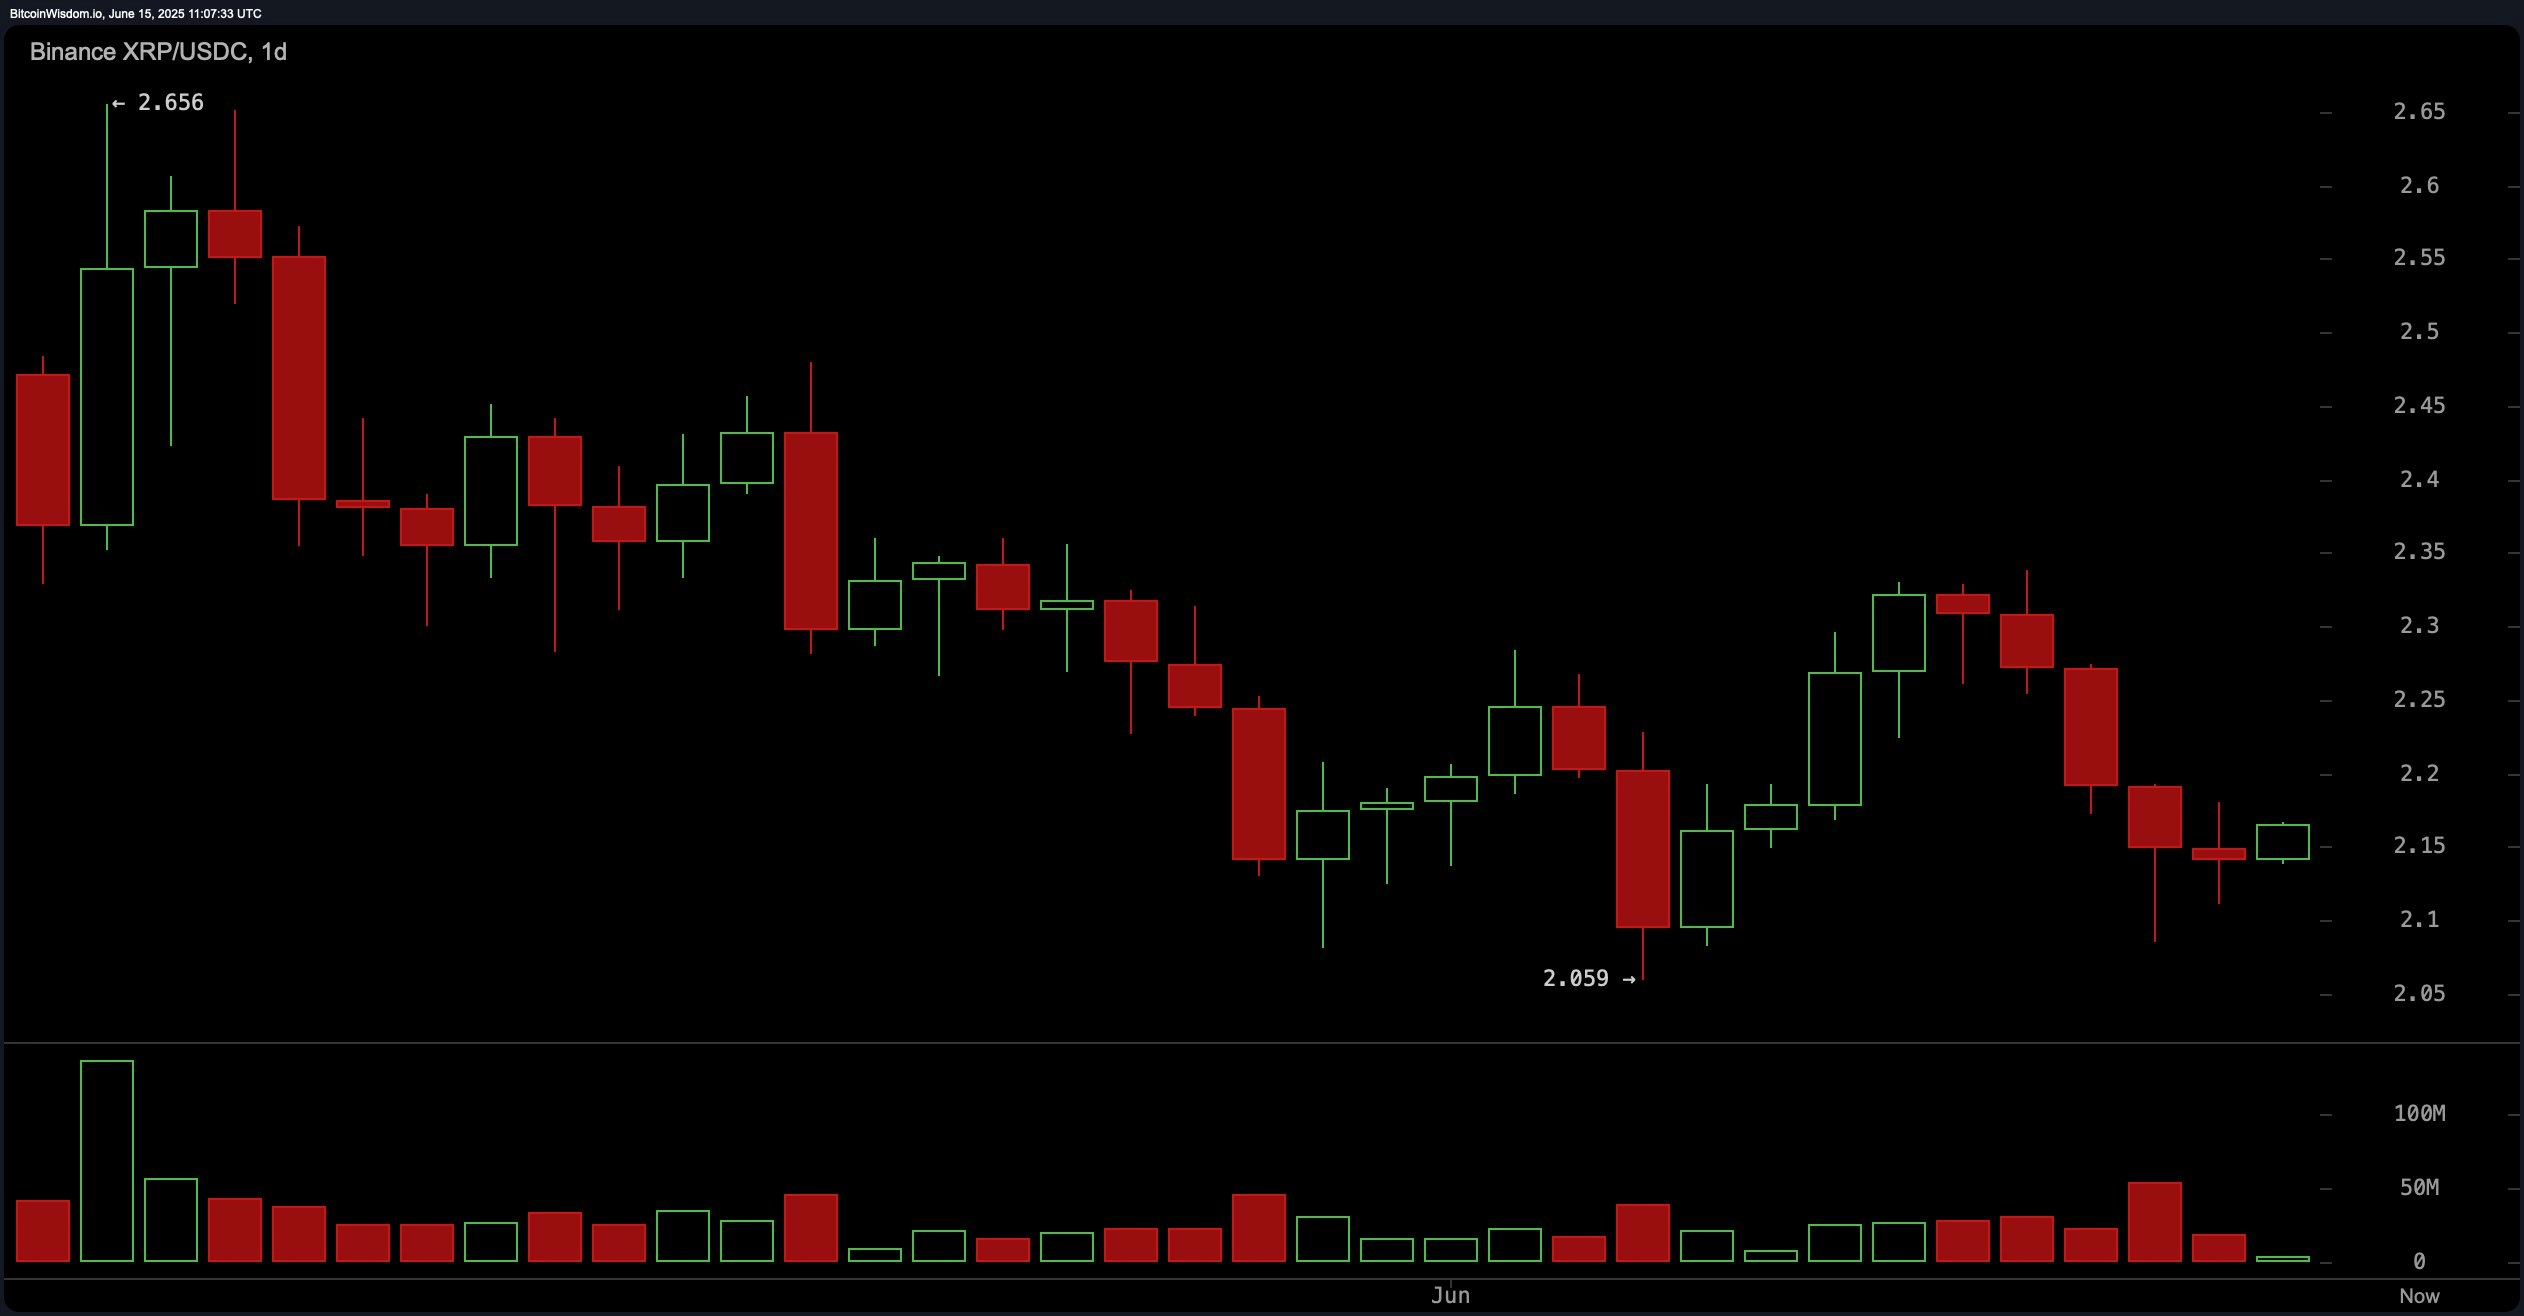 XRP/USDC via Binance on June 15, 2025, daily chart.
The oscillator data offers a mixed outlook. The relative strength index (RSI, 14) stands at 44.17, signaling a neutral momentum. The Stochastic oscillator at 33.03 and the commodity channel index (CCI, 20) at 65.81 both support a neutral stance. The average directional index (ADX) at 17.73 reflects a weak trend. The Awesome oscillator at 0.09626 is also neutral, while the momentum at 0.07083 is the lone indicator flashing a bullish signal. The moving average convergence divergence (MACD, 12, 26) at 0.02835 confirms a bearish bias, currently suggesting negative sentiment.
Moving averages are predominantly bearish across the board. Both the 10-period exponential moving average (EMA, 10) at $2.19963 and the simple moving average (SMA, 10) at $2.21529 indicate a bearish signal. This trend continues across the 20-, 30-, 50-, and 100-period EMAs and SMAs, all of which remain above the current price, reinforcing downward momentum. Interestingly, the 200-period EMA at $2.09282 offers the only bullish signal, implying a long-term floor, while the 200-period SMA at $2.37713 still reflects bearish positioning. This extensive alignment of moving averages with selling pressure confirms the overarching downward trend in XRPs price trajectory.
Bull Verdict:
XRP is exhibiting signs of short-term accumulation, particularly on the one-hour chart, with higher lows and a steady climb toward resistance. A breakout above $2.18, confirmed with strong volume, could pave the way for a move toward $2.25 and potentially test the $2.30$2.35 resistance zone. Momentum indicators such as the 10-period Momentum oscillator suggest a possible bullish shift. However, bulls must remain cautious and await confirmation above the $2.20 level to validate a sustainable upward trend.
Bear Verdict:
Despite minor intraday rebounds, XRPs broader price structure remains under pressure, with all key moving averages except the 200-period EMA pointing to continued bearish momentum. The daily chart reflects a pronounced downtrend from recent highs, and oscillators such as the Moving Average Convergence Divergence (MACD) and Commodity Channel Index (CCI) lean toward a bearish sentiment. If support at $2.10 fails, XRP could retest the $2.05 level or lower, exposing it to further downside risk in the absence of a confirmed bullish reversal.
markets and prices Ripple XRPImage Credits: Shutterstock, Pixabay, Wiki Commons