XRP is trading at $3.06 with a market capitalization of $181.57 billion and a 24-hour trading volume of $11.35 billion. The digital asset moved within a 24-hour intraday price range of $3.06 to $3.34, reflecting high volatility amid ongoing bearish pressure.
 Jamie Redman
XRP
On the 1-hour chart, XRP shows signs of near-term consolidation following a sharp breakdown from $3.34 to $2.97. Although there was a temporary bounce toward the $3.15 region, the price is currently hovering around $3.07 to $3.10, indicating weak follow-through from buyers. A notable spike in volume during the breakdown candle signals substantial selling pressure, likely from institutional participants. Attempts to push higher have faced rejection at $3.15, establishing this level as short-term resistance. The coin appears to be forming a base near $3.05, with bullish momentum only resuming if $3.12 is reclaimed.
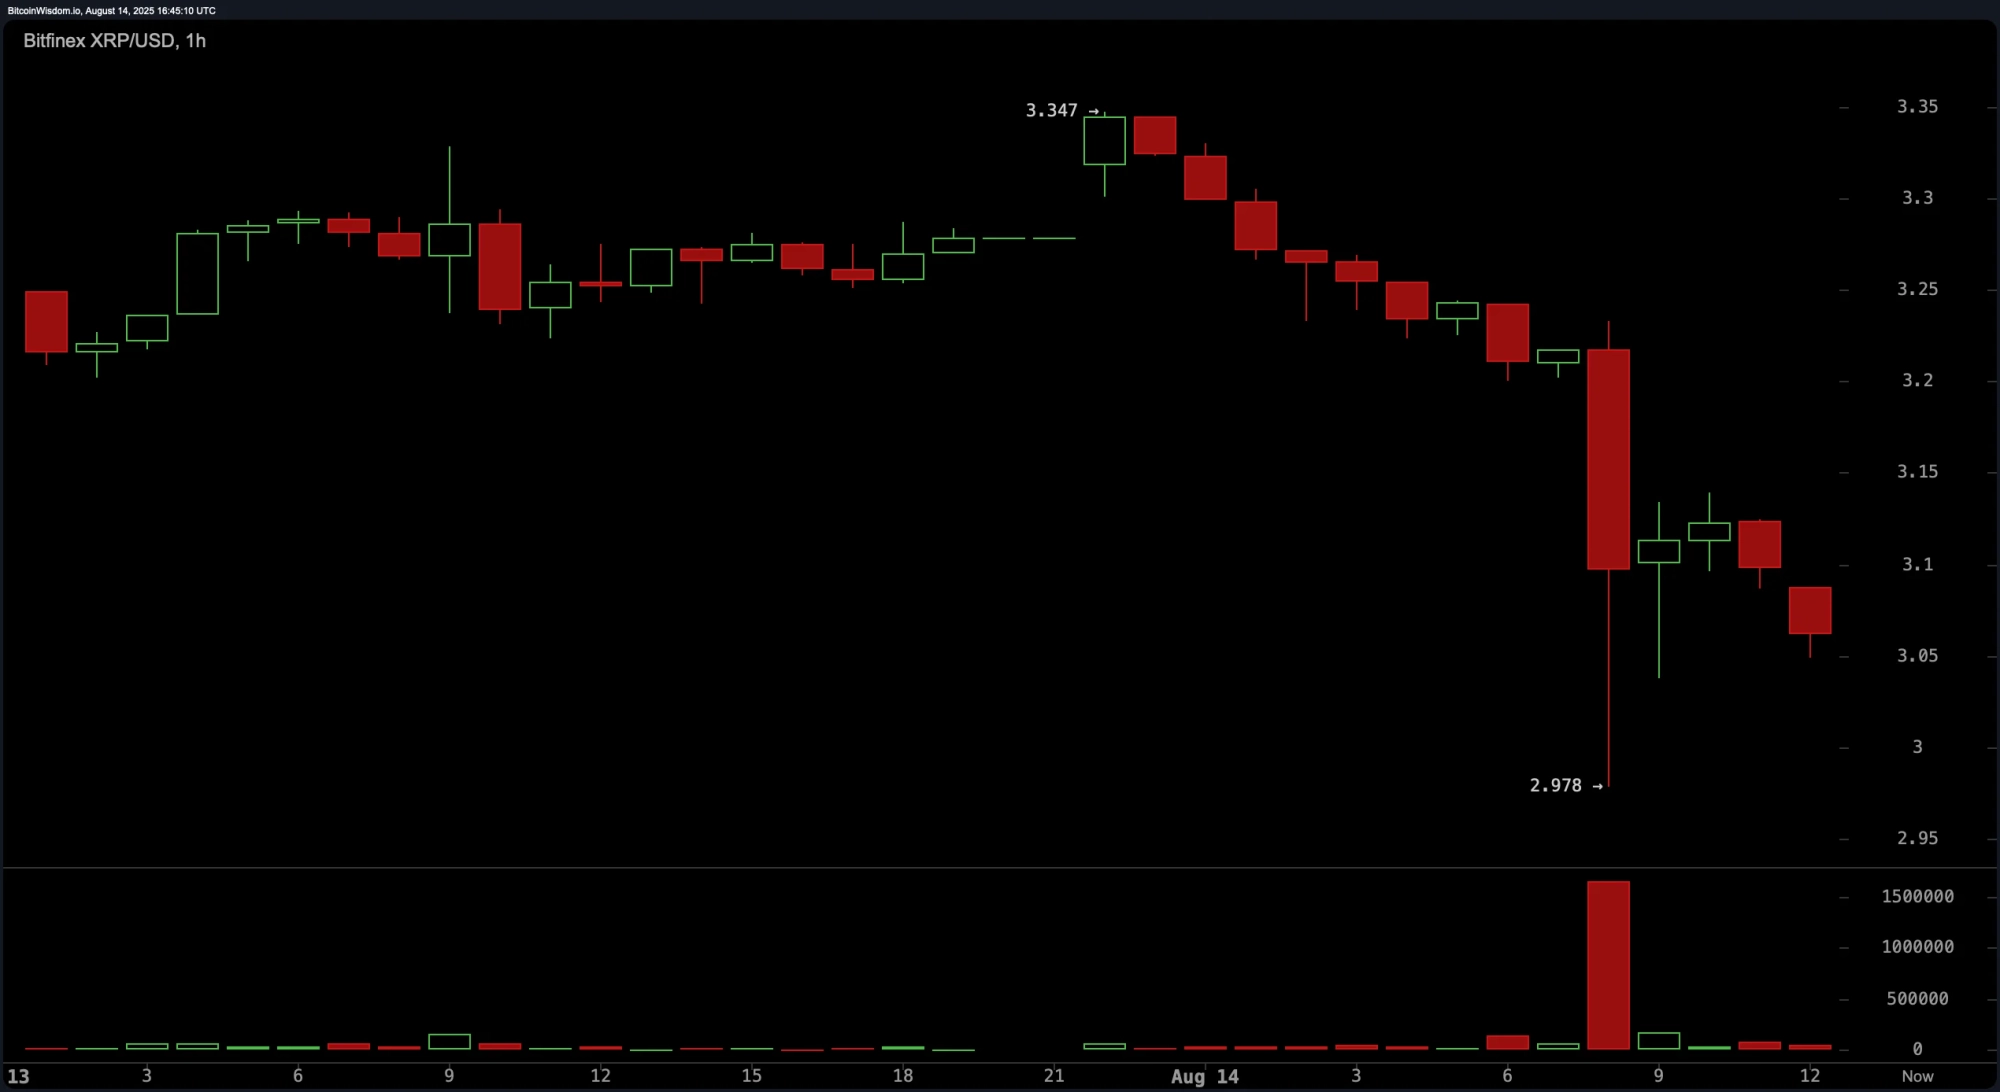 XRP/USD via Bitfinex 1-hour chart on Aug. 14, 2025.
The 4-hour chart supports the broader bearish narrative, with XRP experiencing a sharp drop from around $3.30 to $2.98 in one decisive candle. Despite a minor recovery attempt, the price remains subdued below $3.10, confirming a pattern of lower highs and lower lows. High-volume red candles indicate dominant sell-side control, while weak rebounds show little buyer commitment. Traders may find speculative entries around $2.95$3.00 with tight stops below $2.90. Resistance is firmly positioned between $3.15 and $3.30, where failed rallies are likely to meet profit-taking.
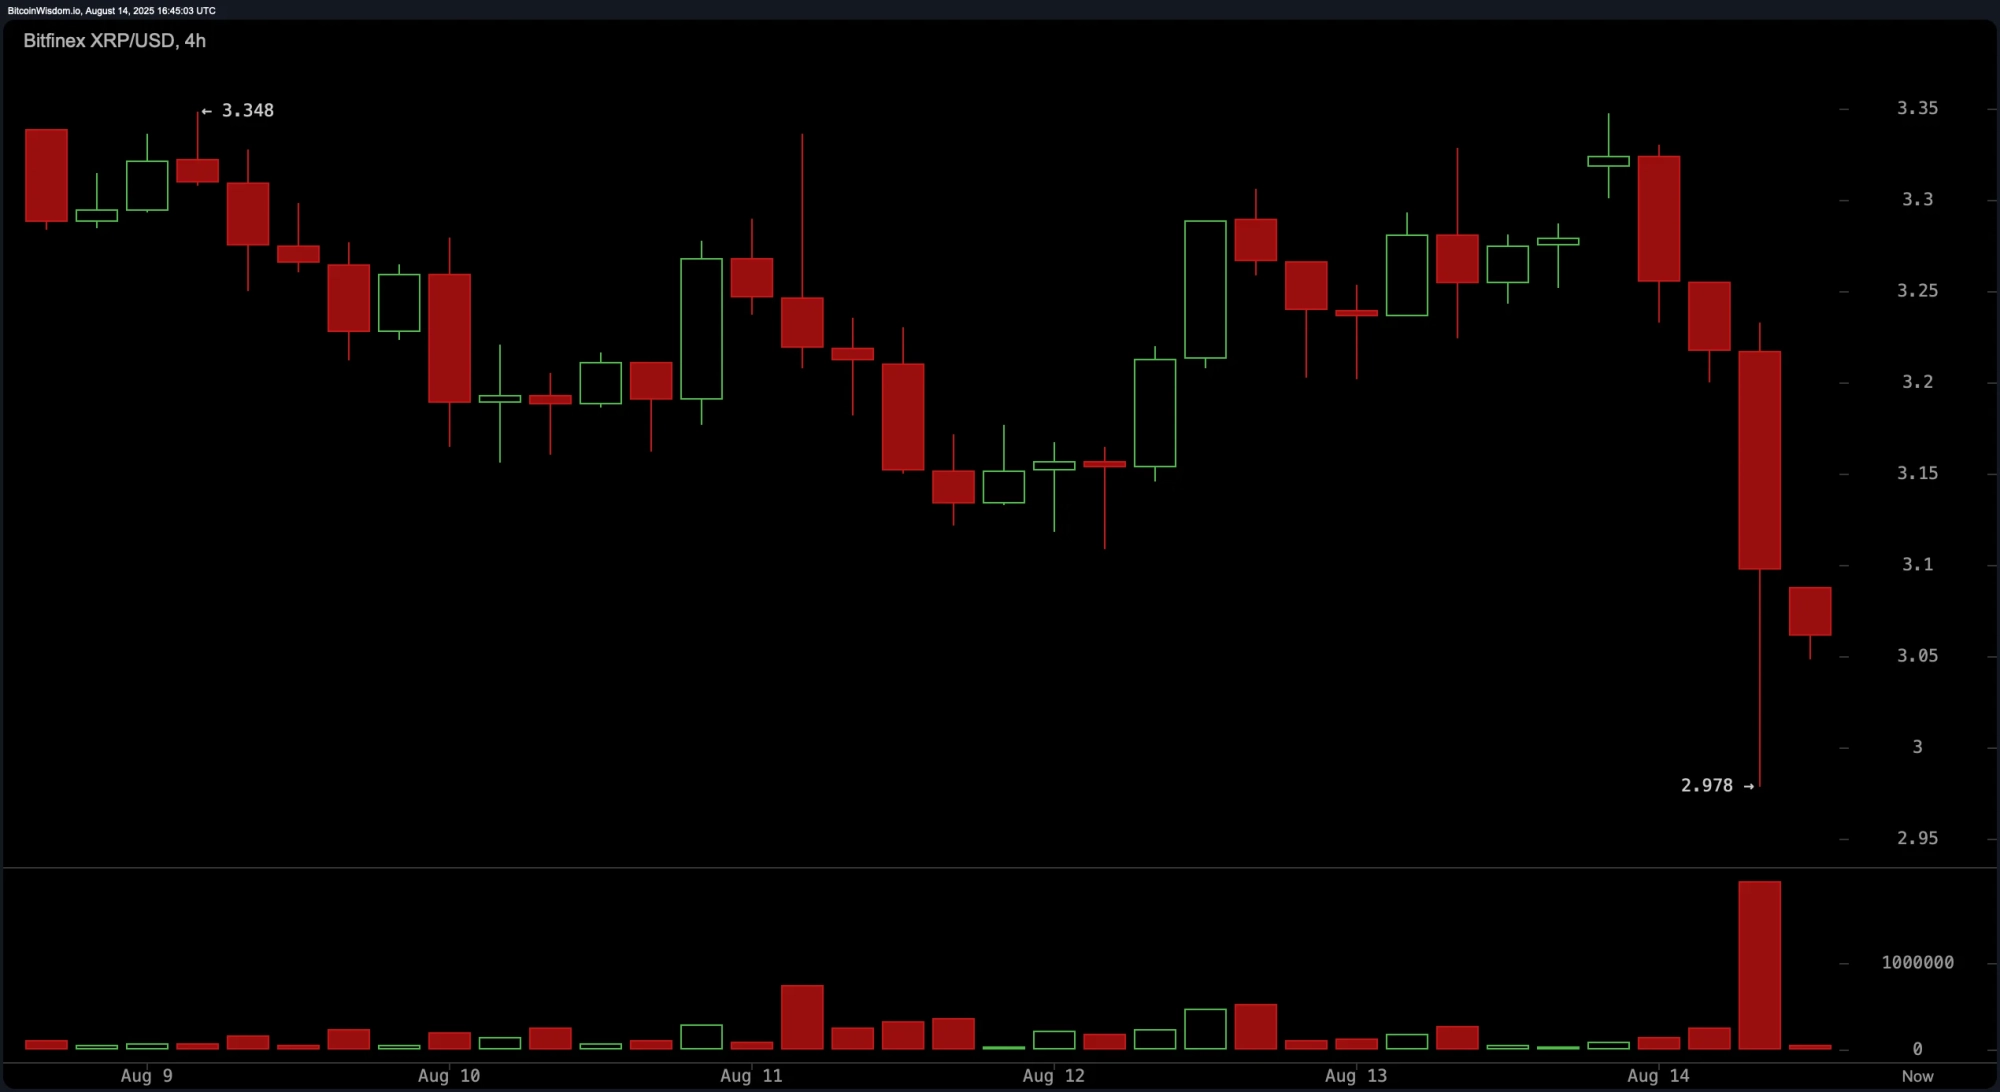 XRP/USD via Bitfinex 4-hour chart on Aug. 14, 2025.
Daily chart analysis further confirms a bearish structure. After peaking near $3.66, XRP has undergone a multi-day correction, breaking below the $3.10 support zone with high volume. The structure now reveals a double top formation around $3.65a classical bearish reversal patternreinforcing caution. The most recent red candle also breached prior swing lows, strengthening the bearish case. Short-term resistance is located at $3.25$3.35, while strong support lies at $2.80$2.90, a level where bulls may consider reentry if the price stabilizes.
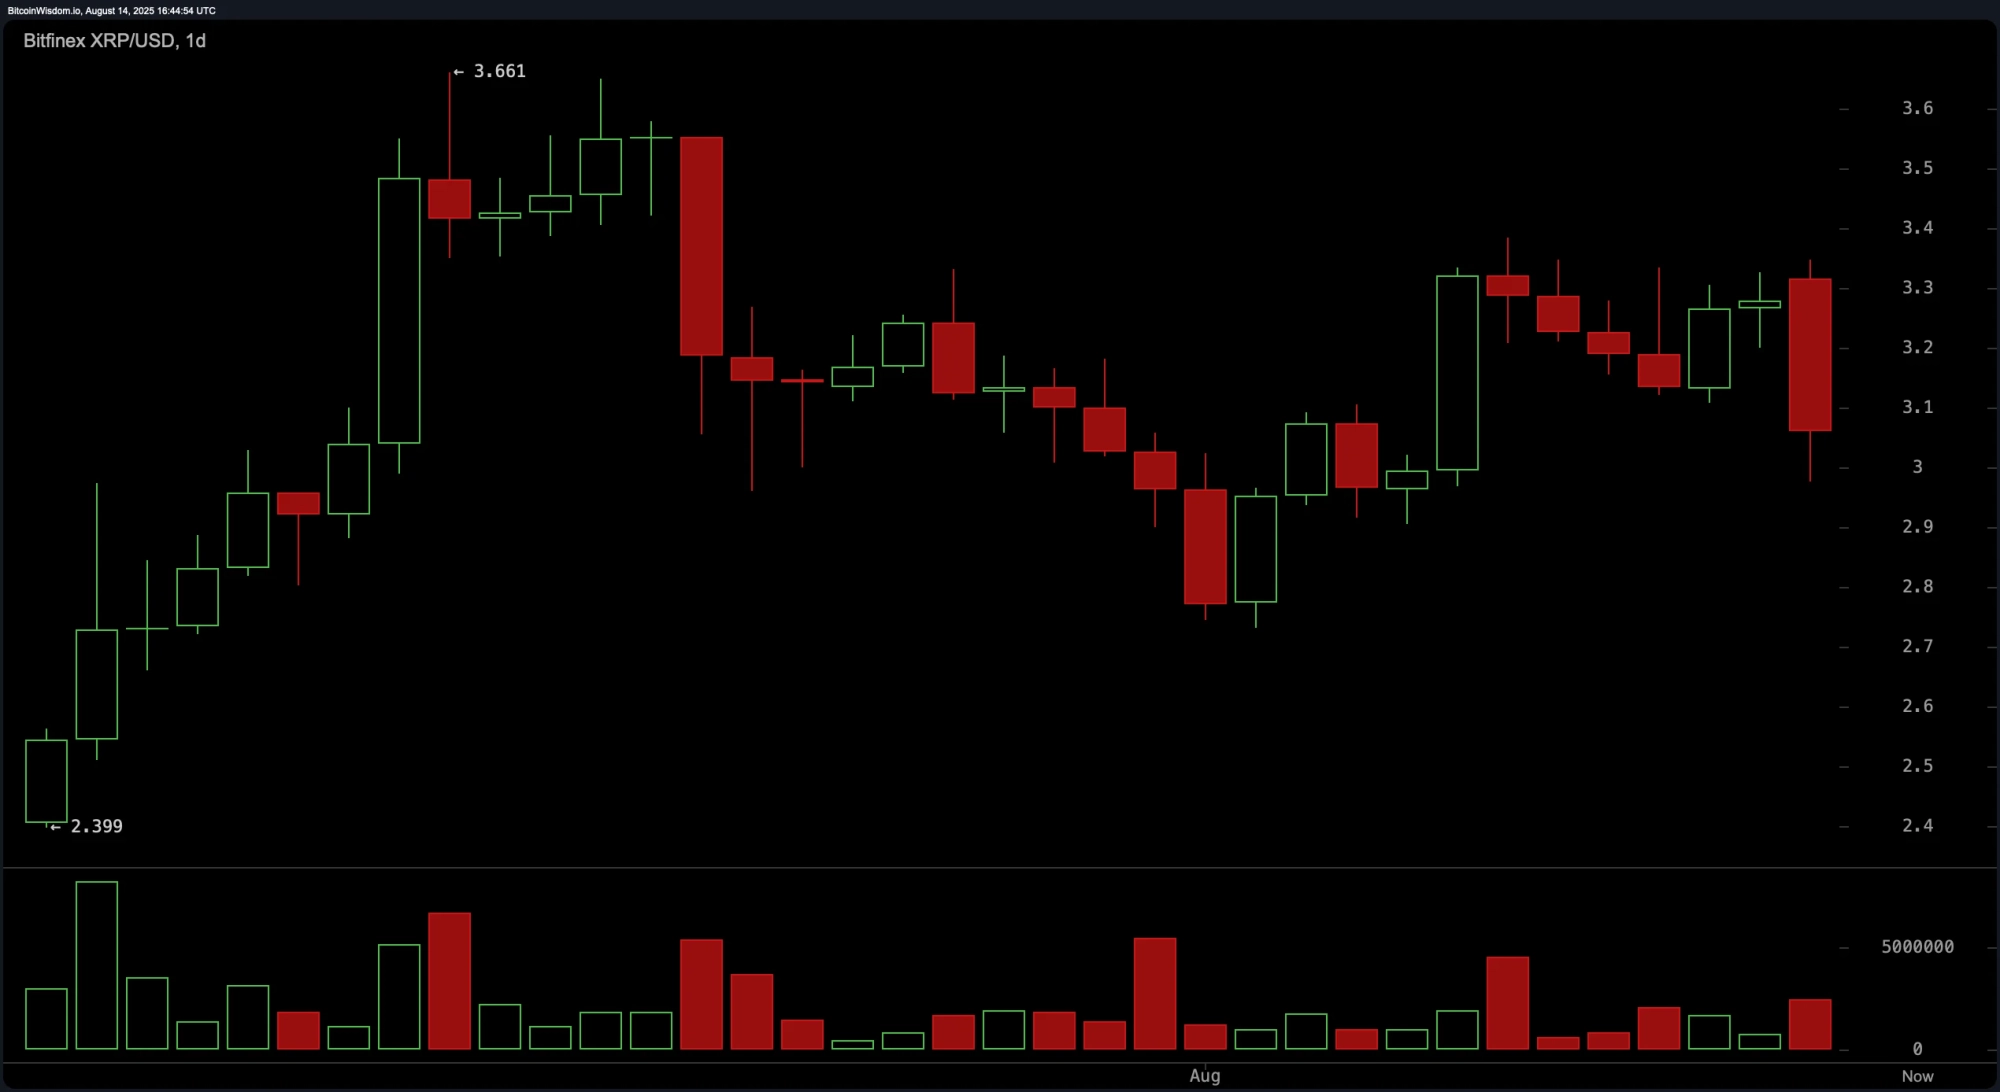 XRP/USD via Bitfinex 1-day chart on Aug. 14, 2025.
Oscillators currently present a mixed but cautious outlook. The relative strength index (RSI) sits at 49.42, indicating a neutral condition, while the Stochastic oscillator stands at 72.47, also in neutral territory. The commodity channel index (CCI) at 13.67 and the average directional index (ADX) at 28.93 both reflect a market lacking clear directional strength. The Awesome oscillator (AO) reads 0.07297 with no clear momentum bias. However, bearish signals emerge from the momentum indicator at -0.00636 and the moving average convergence divergence (MACD) at 0.06964, both suggesting selling pressure.
Moving averages (MAs) further validate the prevailing downtrend. Short-term indicators such as the exponential moving average (EMA) and simple moving average (SMA) over 10 and 20 periodsEMA(10) at $3.16212 and SMA(10) at $3.17122, EMA(20) at $3.12245 and SMA(20) at $3.11169are signaling bearish action. Only the EMA over 30 periods, EMA(30) at $3.05865, offers a bullish signal, while its simple counterpart, SMA(30) at $3.18784, remains bearish. Long-term moving averages from 50 to 200 periods are all firmly in a bullish territory, with EMA(200) at $2.42118 and SMA(200) at $2.45647, indicating strong foundational support beneath the current price level.
Bull Verdict:
XRPs current consolidation above key support levels, combined with long-term moving averages signaling continued upside, suggests that the broader uptrend remains intact. If bulls can reclaim the $3.12 to $3.25 range with strong volume, a renewed rally toward $3.34 and beyond remains on the table, supported by institutional buying on dips.
Bear Verdict:
The dominance of bearish price structures across intraday and daily charts, combined with weak momentum indicators and persistent resistance at $3.15 to $3.35, points toward further downside risk. Unless the price decisively reclaims $3.25, the path of least resistance remains lower, with a potential retest of the $2.90 to $2.95 support zone likely in the near term.