XRP is trading at $2.22 on Saturday, July 5, with a market capitalization of $131 billion. The digital asset recorded a 24-hour trading volume of $1.33 billion, fluctuating within an intraday range of $2.20 to $2.24, while the weekly range stands at $2.17 to $2.30.
XRP
On the 1-hour chart, XRP is exhibiting a clear consolidation phase, trading within a narrow range between $2.196 and $2.26. The horizontal movement since July 4 reflects a low volatility compression zone, which is often a precursor to a decisive move. With prices repeatedly testing the boundaries of this range, traders may consider scalping strategies, such as buying near $2.20 and selling near $2.26, until a breakout confirms a new directional bias. A breakout above $2.26 would indicate bullish momentum, whereas a drop below $2.196 may trigger a bearish leg.
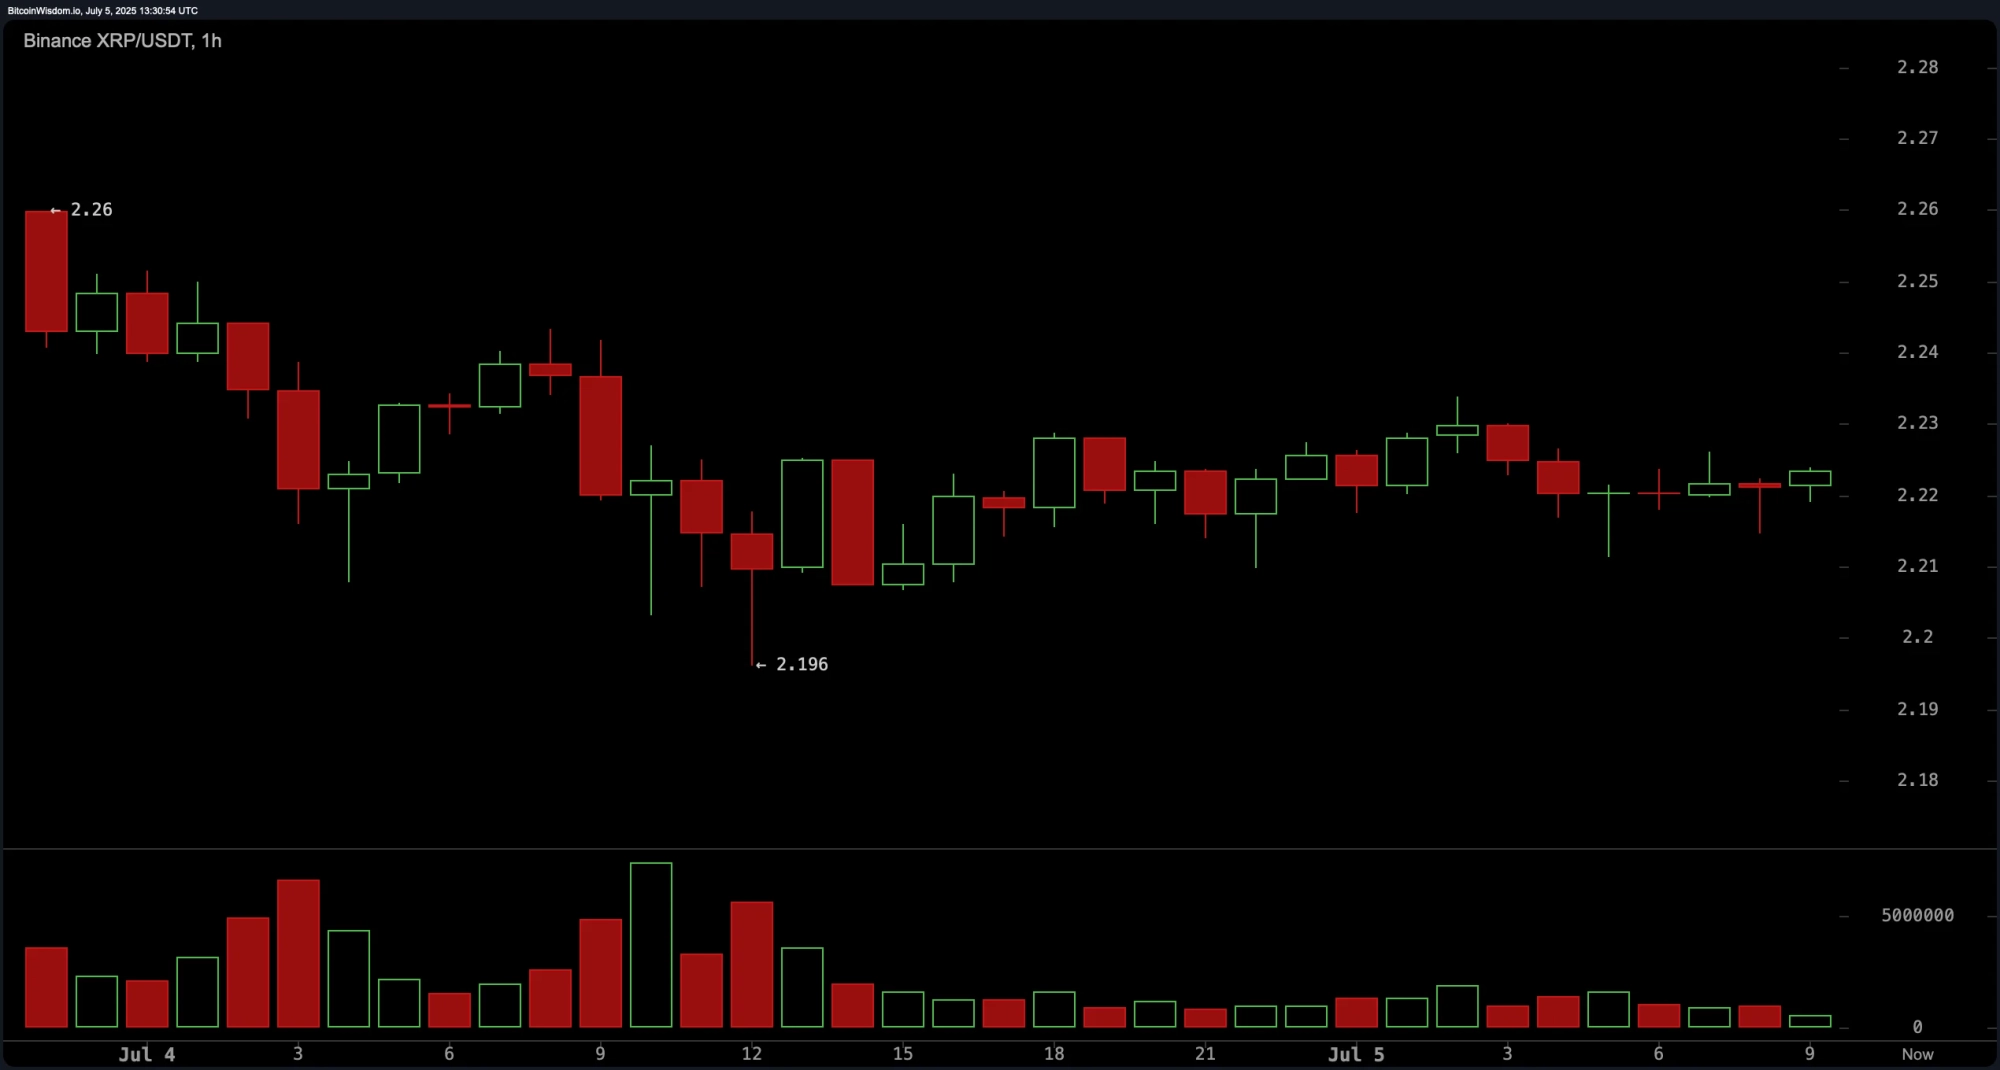 XRP/ USDT via Binance on July 5, 2025, 1-hour chart.
The 4-hour chart presents a more cautious outlook. XRP is showing signs of short-term weakness, forming a rounded top pattern between $2.147 and $2.327. Following a notable bullish candle on July 1, selling pressure has gradually increased, accompanied by declining volumesuggestive of buyer fatigue. The consistent formation of lower highs and lower closing prices reinforces a bearish structure. For directional trades, a move above $2.26$2.28, confirmed with volume, would support a long entry. Conversely, a breakdown below $2.21 with escalating sell volume could validate a short setup targeting the $2.15$2.18 zone.
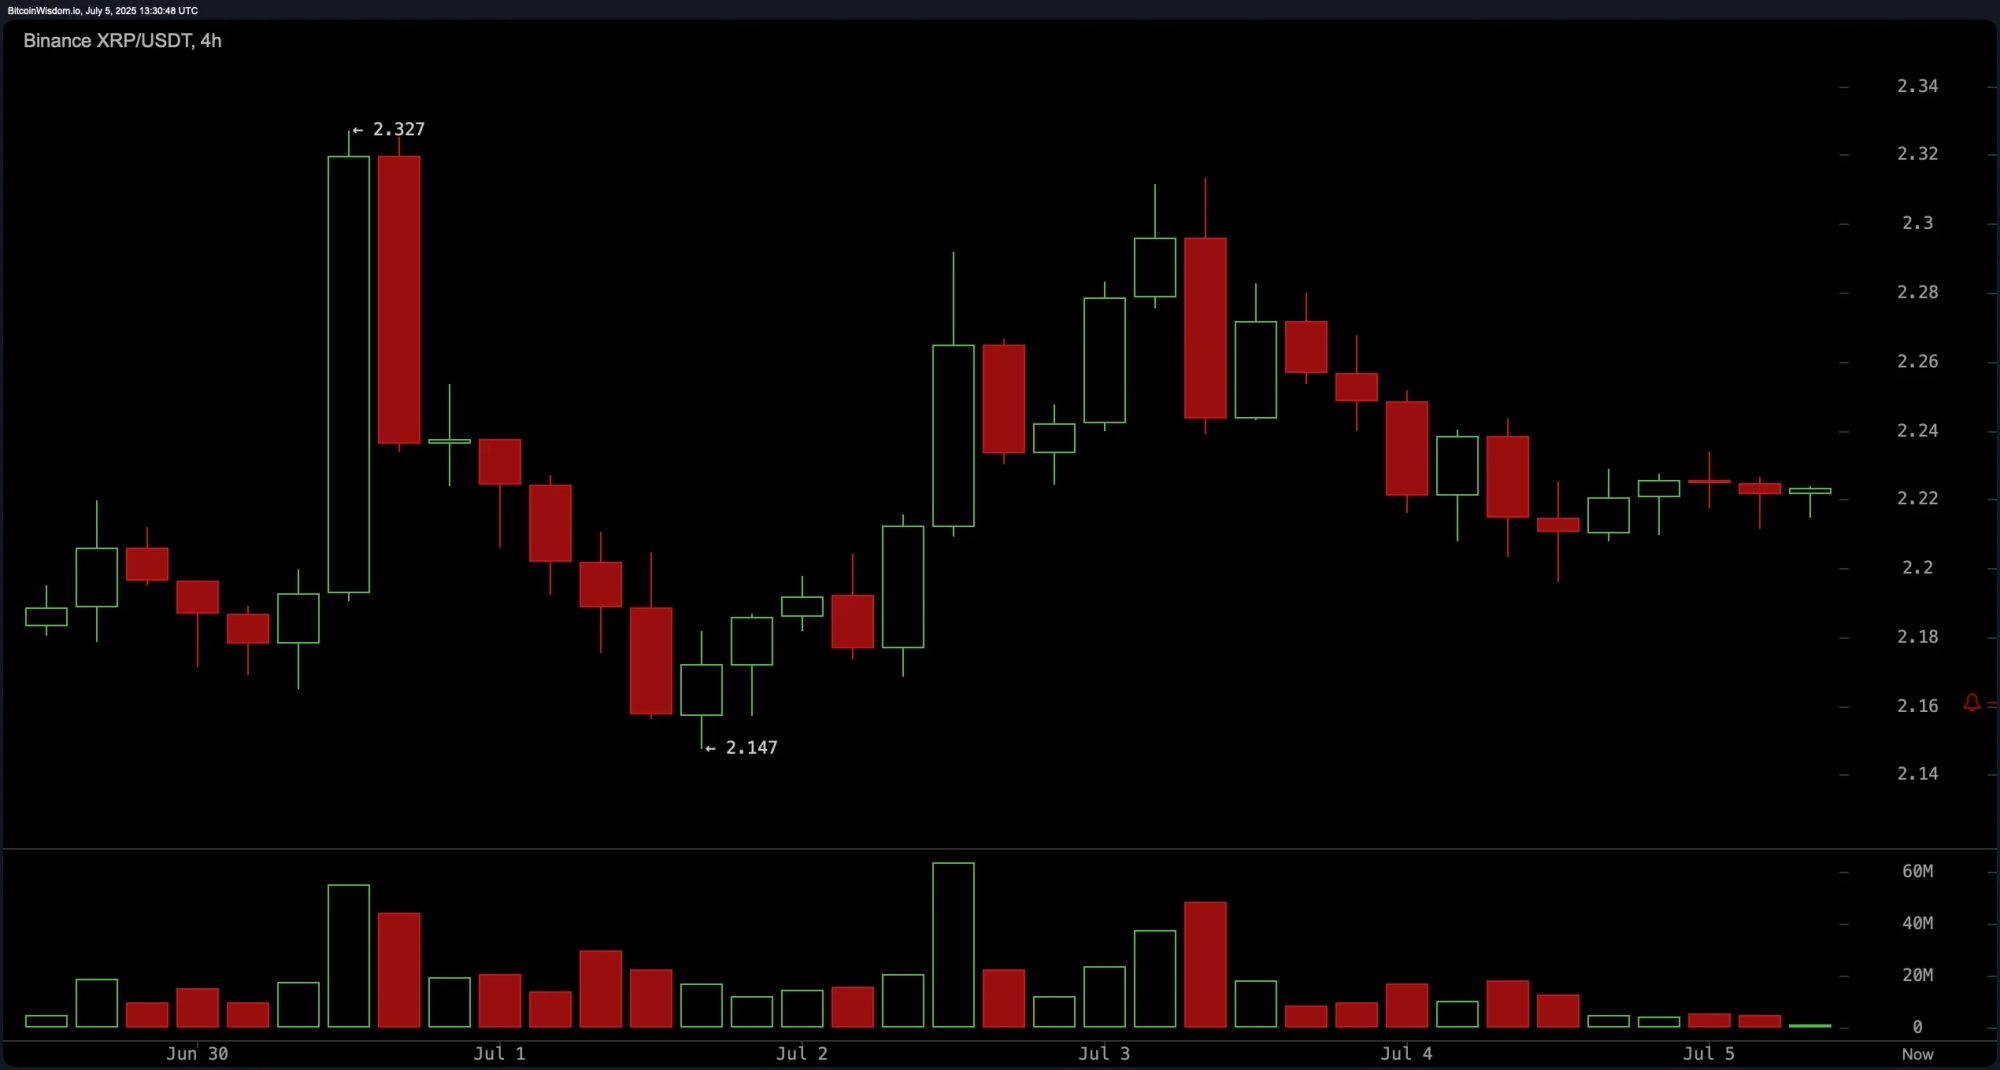 XRP/ USDT via Binance on July 5, 2025, 4-hour chart.
XRPs daily chart remains structurally bullish despite the short-term consolidation. Following a mid-June downtrend, XRP rebounded from a local low of $1.908 and has since stabilized above $2.20. The emergence of bullish engulfing candles near the $1.90$2.00 support region signifies buying interest. With resistance forming at $2.30$2.34, a break above this band may pave the way for retests of $2.34 and higher, contingent on volume confirmation. Maintaining a price above $2.20 will be essential for the bullish narrative, while any breach below $2.15 could invalidate upward momentum.
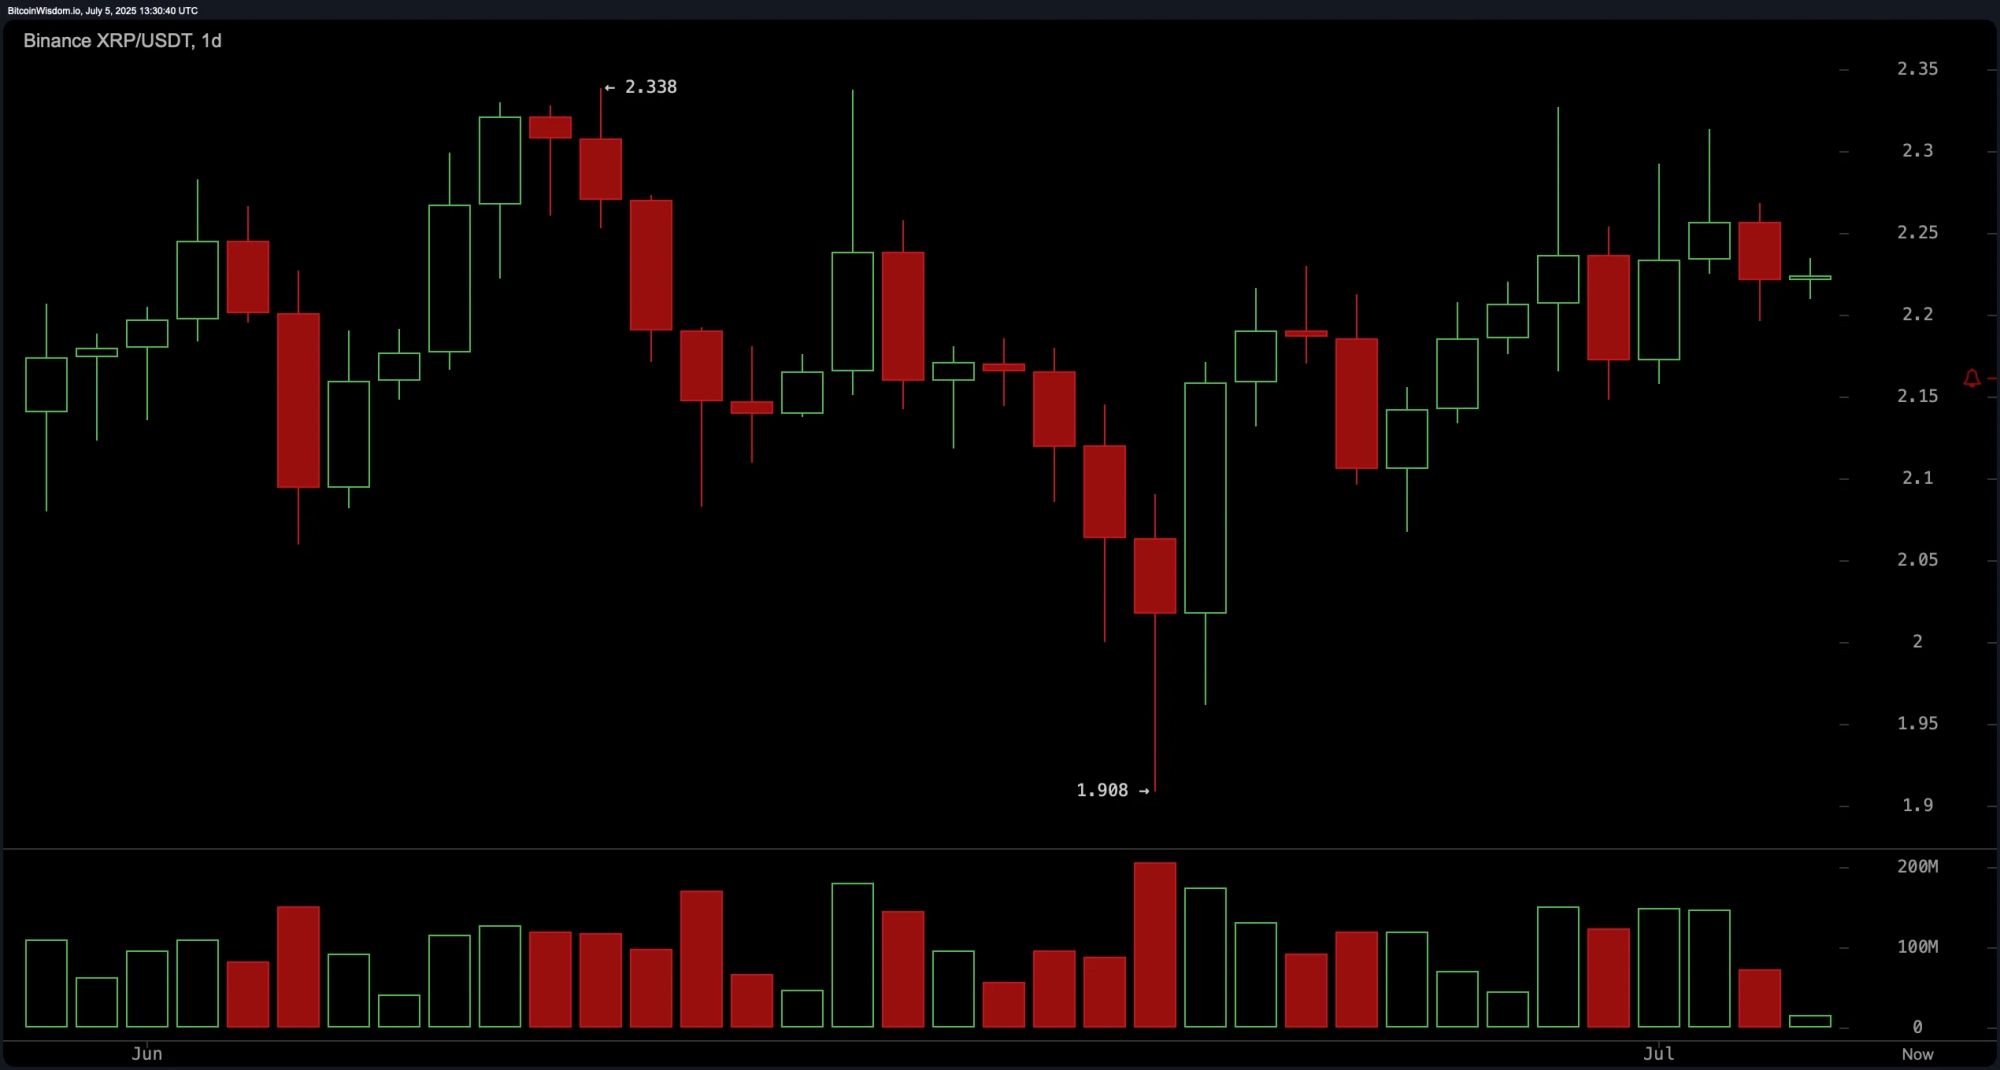 XRP/ USDT via Binance on July 5, 2025, daily chart.
Oscillators across multiple time frames are mostly neutral, suggesting indecision in the market. The Relative Strength Index (RSI) at 52.45, Stochastic %K at 77.74, and the Commodity Channel Index (CCI) at 68.33 all reflect equilibrium. The Average Directional Index (ADX), reading 12.50, confirms a weak trend. While the Awesome Oscillator at 0.04542 remains neutral, the Momentum indicator at 0.03783 signals a buy, as does the Moving Average Convergence Divergence (MACD) level (12, 26), which reads 0.00559. Notably, the Stochastic Relative Strength Index (Stochastic RSI Fast) at 89.88 indicates an overbought condition, suggesting possible short-term exhaustion.
Moving averages (MAs) paint a broadly positive picture with notable exceptions. Short-term averages such as the exponential moving average (EMA 10) at $2.20689 and the simple moving average (SMA 10) at $2.19902 both signal bullish actions. Medium-range indicators like EMA 20, SMA 20, EMA 30, and SMA 30 also confirm bullish sentiment. Longer-term indicators present mixed signals: EMA 50 and SMA 100 indicate positivity, while SMA 50, EMA 100, and SMA 200 point to a negative zone. This divergence suggests that while short-to-mid-term momentum favors bulls, broader resistance levels are still in play and should be watched closely.
Bull Verdict:
XRP maintains a bullish structure on the daily chart, supported by positive momentum indicators and favorable short- to mid-term moving averages. A breakout above the $2.30 resistance zone, backed by volume, could propel the asset toward $2.34 and potentially higher, reinforcing bullish conviction.
Bear Verdict:
Despite macro strength, the presence of rounding tops, fading volume, and overbought oscillators on lower timeframes raise caution. A decisive breakdown below $2.20especially under $2.196could signal a short-term reversal toward $2.15, exposing XRP to further downside risk.