Bitcoin ATH Drags ETH/BTC To Lowest Point In 3 Years – What’s Next For Ethereum?
As Bitcoin (BTC) reached a new all-time high (ATH) of $98,310 today, the ETH/BTC trading pair fell to multi-year lows, raising questions about the relative strength of Ethereum (ETH), the second-largest digital asset.
What’s Causing Ethereum’s Underperformance Against Bitcoin?
Bitcoin’s new ATH earlier today brings it within $2,000 of the coveted $100,000 mark. However, BTC’s sustained dominance has resulted in the underperformance of altcoins, particularly Ethereum, throughout the year.
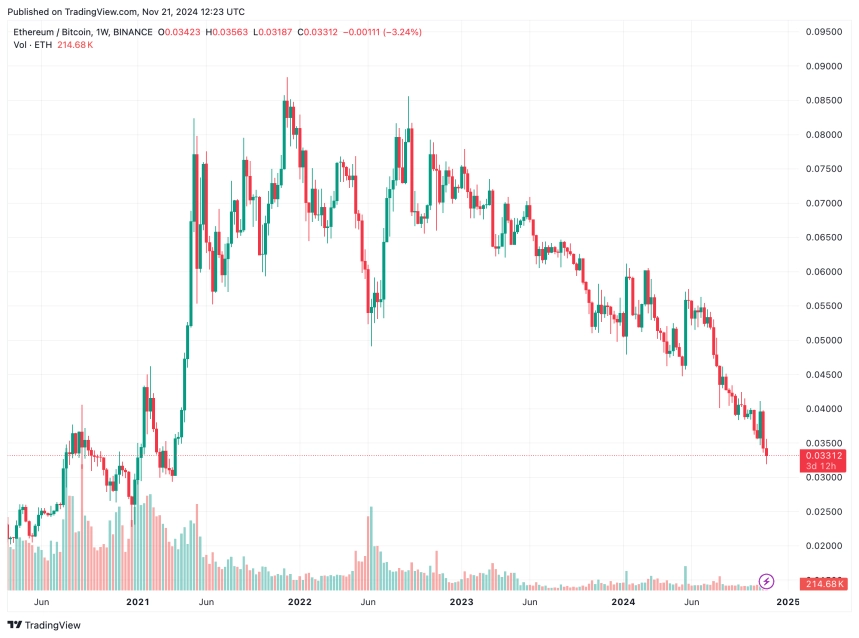
The weekly chart below reveals that the ETH/BTC trading pair has dropped to a multi-year low of 0.0331 – a level last seen in March 2021. Since December 2021, the pair has failed to form a new higher high, reflecting a decline of over 60%.
 ETH/BTC trading pair continues to record new lows on the weekly chart | Source: ETHBTC on TradingView.com
The pair’s losses have accelerated since July 2024, coinciding with Bitcoin’s price surge, driven by rising optimism over pro-crypto Republican candidate Donald Trump’s prospects in the U.S. presidential election.
The success of Bitcoin exchange-traded funds (ETFs) has also contributed to institutional preference for BTC over other cryptocurrencies. At present, BTC ETFs hold more than $100 billion in total net assets.
While Ethereum ETFs have also received regulatory approval, they haven’t matched the success of their Bitcoin counterparts. For instance, US-based spot Ethereum ETFs have accumulated only $8.96 billion in total net assets so far.
Additional factors, such as Bitcoin’s halving in April 2024 – reducing miner rewards from 6.25 BTC to 3.125 BTC—have further reinforced BTC’s supply scarcity narrative. In contrast, Ethereum’s rising issuance rate has led some experts to question its “ultrasound money” status.
Additional factors such as Bitcoin halving in April – which slashed miner rewards from 6.250 BTC to 3.125 BTC – further reinforced the digital asset’s supply scarcity narrative. In contrast, Ethereum’s rising issuance rate has led some experts to question its “ultrasound money” status.
When Will Ethereum Recover Losses Relative To BTC?
With the ETH/BTC trading pair hitting new lows, Ethereum traders are eager to know when ETH might recover its losses. Several analysts have shared their views on X.
Crypto analyst @CryptoGemRnld recently identified two strong support zones: a trendline support and a demand box zone. According to the analyst, since 2017, the ETH/BTC pair has historically rebounded from these levels, often leading to altcoin seasons.
Similarly, seasoned trader Peter Brandt has suggested that the ETH/BTC ratio may be approaching its bottom. Brandt’s analysis predicts a potential reversal in December, with the trading pair beginning an upward trajectory.
Supporting this outlook, recent data indicates that ETH may be undervalued at current prices. The limited inflow of ETH to exchanges, coupled with a lack of significant profit-taking, suggests that ETH bulls are holding out for further gains.
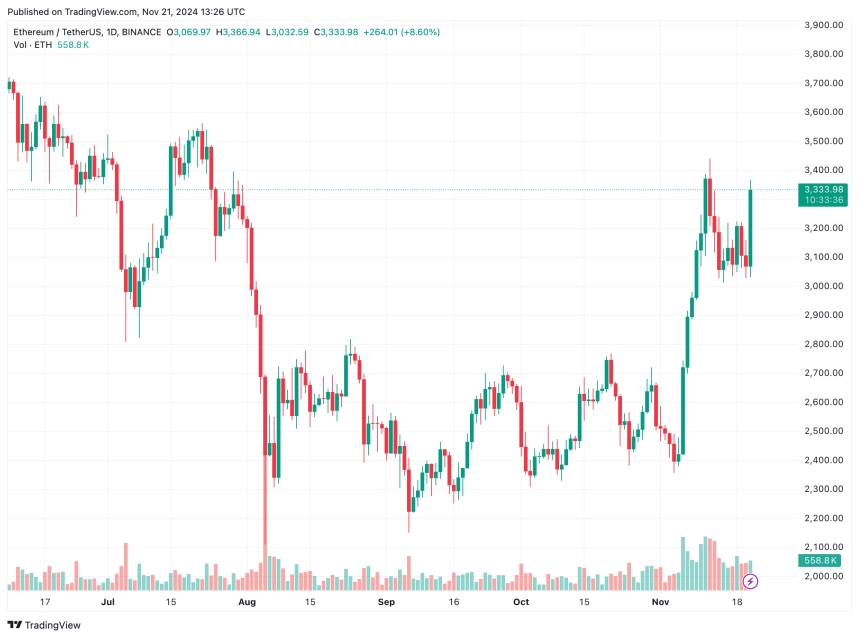
Additionally, spot ETH ETFs have been recording significant inflows, attracting over $515 million between November 9 and November 15. At press time, ETH trades at $3,333, up 7.4% in the past 24 hours.
 ETH trades at $3,333 on the daily chart | Source: ETHUSDT on TradingView.com
Featured image from Unsplash, charts from Tradingview.com


