Bitcoin Reaches $70K, Will The All-Time High Breakout Pump BTC Price To $100K?

Following the shake-out and hype of Donald Trump’s speech on pro-crypto regulations last Saturday, the BTC price is back on track. With an intraday gain of 2.57%, the biggest crypto has now reached the $70K mark.
Last witnessed in early June, the BTC price marks out a quick V-shape reversal pattern, revealing the massive underlying demand. Surviving the Mt. GOX threat and the early drop in Ethereum ETFs, the uptrend teases a breakout run for a new all-time high. Will this breakout turn the highly anticipated Bitcoin price prediction of $100,000 in 2024 into reality?
Bitcoin Price Performance
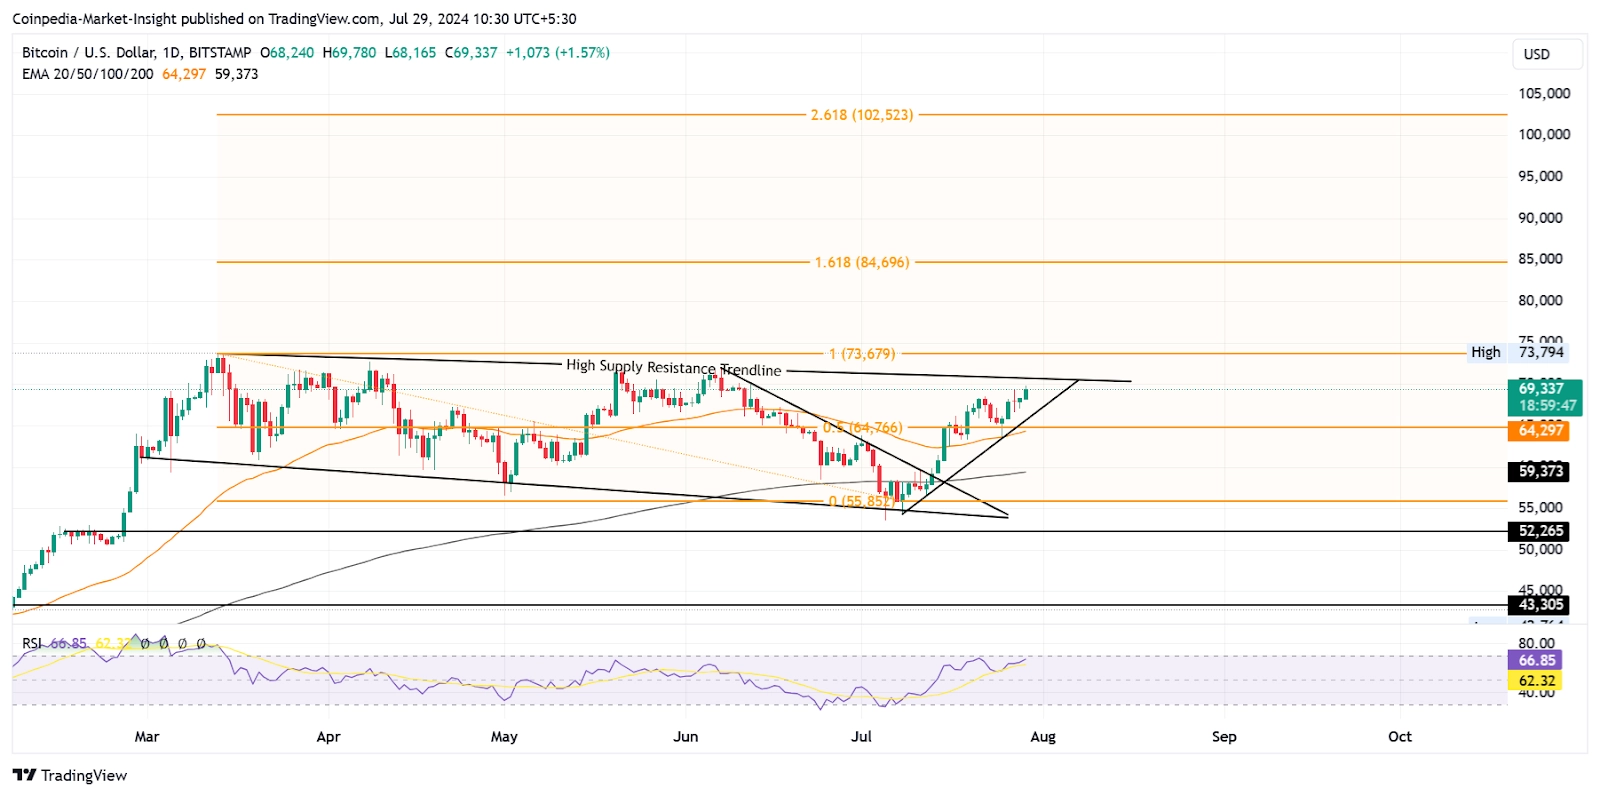
With a bullish recovery rally starting from $55K, Bitcoin price quickly jumps 25% in three weeks to reclaim the lost levels. Crossing above the 50% Fibonacci level at $64,766 and the $70K mark, the BTC price now heads for a trendline breakout.
Tradingview
Challenging the overhead trendline of the flag pattern’s channel in the daily chart, the rising demand bolsters the bull run.
Technical indicators:
RSI: The daily RSI line hits the overbought boundary, reflecting the rise in demand. Thus, the rising demand increases the possibility of a bullish breakout, but the overbought nature could result in a minor retest.
EMA: The bullish trend in the BTC price inflicts a bullish influence over the 200D and 50D EMA, creating two rising dynamic supports.
With Growing Bitcoin ETFs, Bitcoin Accumulate Trend Score Hits 1
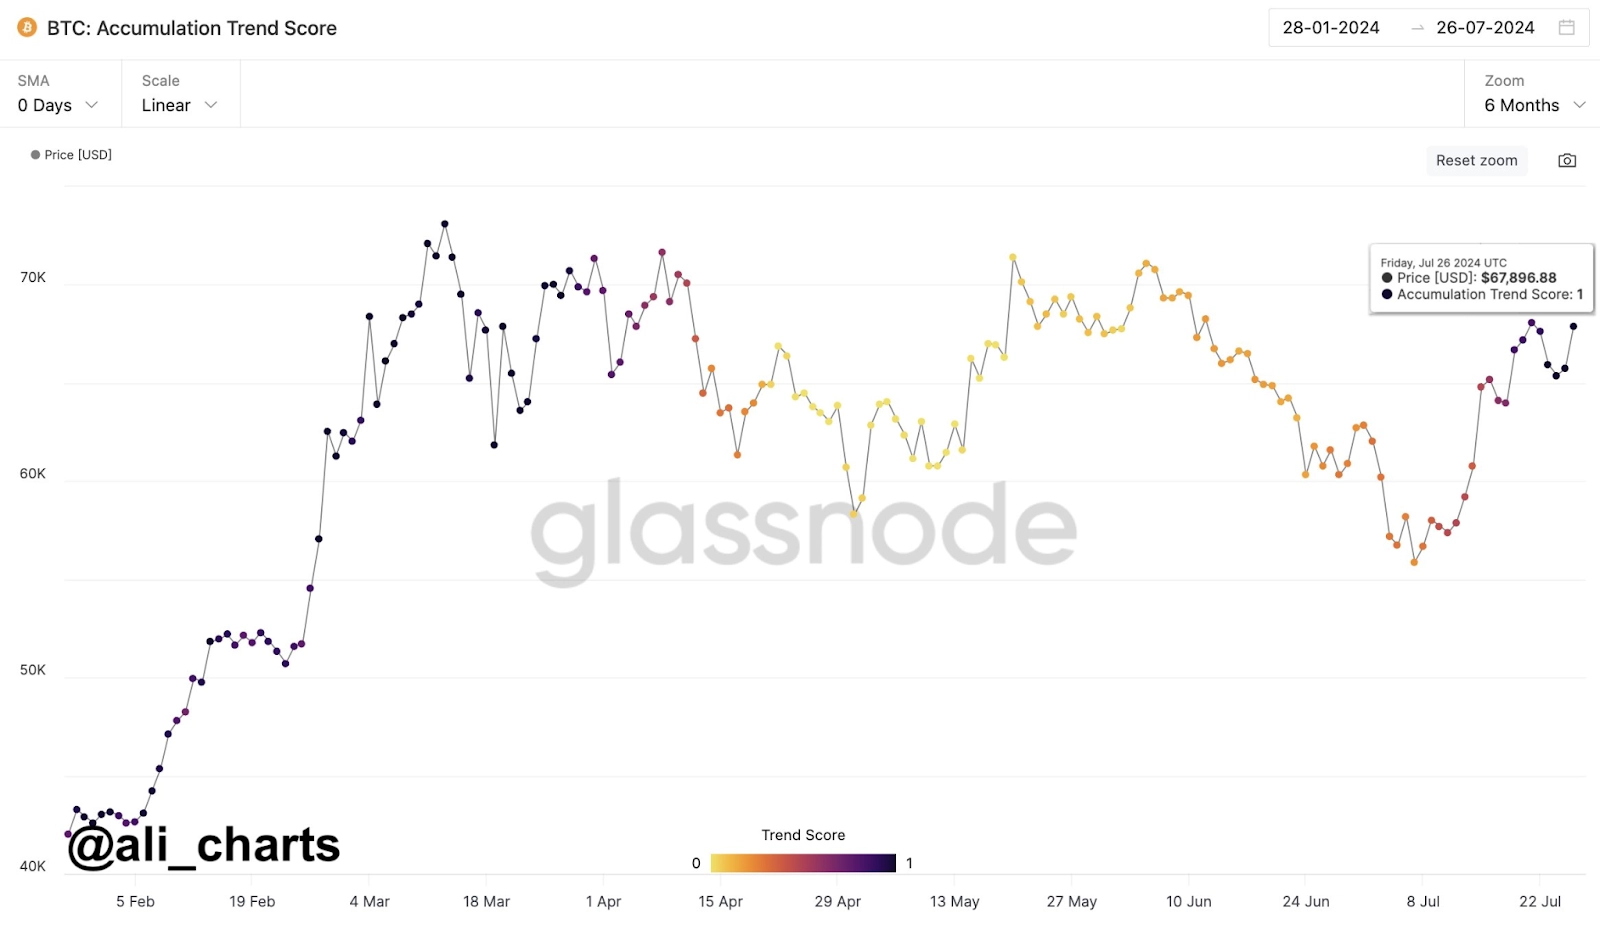
The Bitcoin Accumulation trend suggests that big players in the market are actively buying and holding Bitcoin. With the increasing US Spot Bitcoin ETFs inflows, the Bitcoin Accumulation Trend Score has reached 1.
Source: https://twitter.com/ali_charts/status/1817537230291743066
The increasing trend score indicates a strong accumulation phase by larger entities. Such accumulation by influential investors and ETFs signals growing confidence with the bull market gaining momentum.
With the broader crypto market gaining momentum, BTC price teases a flag breakout rally in the daily chart. Further, the underlying bullish gears are starting to turn, and the fundamentals and on-chain are improving quickly.
As per the Fibonacci levels, the bullish breakout rally of the flag pattern could reach the 1.618 level at $102K. Hence, the uptrend is likely to hit surpass the $100K in the coming months.
