Mass Liquidations, Billions Wiped | How I Protect My Portfolio!
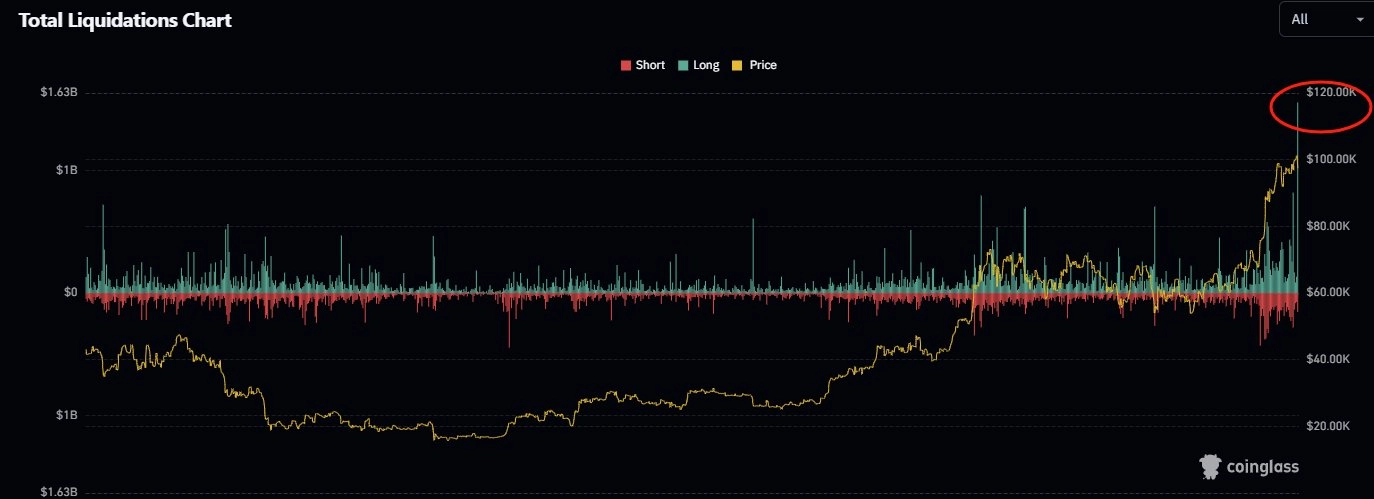
- $813,000,000 liquidated in 60 minutes, $1.7 billion gone in 24 hours!
- The key charts I personally watch during volatile times: OTHERS, TOTAL, and USDT Dominance (USDT.D).
- How I position my portfolio during volatile moments to suit my trading style.
$63,000 Turnaround! Here’s David’s Story
First, a massive shoutout to one of Empire Crypto Trading’s members, David G, for pulling off an incredible turnaround! He went from losing $37,000 USD and having $7,000 USD left to $70,000 USD—a $63,000 transformation. Here’s what David had to say:
“Had a pretty amazing week this week—actually, it was the best week of my trading career! I’m really seeing the past 12 months of dedication paying off!”
David’s results are his own and reflect his dedication and persistence. His journey is a reminder that success in trading takes time and effort, and that learning trade isn’t something that comes overnight.

Mass Liquidation Event: My Observations
The crypto market recently saw a massive liquidation wave. According to Coinglass, more than 562,000 traders were liquidated in 24 hours, with $1.7 billion wiped from the market. The largest single liquidation happened on Binance’s ETHUSDT pair, valued at $19.69 million.
Advertisement

From what I’ve observed, these events often occur when the market becomes overleveraged. Indicators like rising funding fees and increasing open interest help me gauge when the market might be in a vulnerable position. While nothing is ever guaranteed, these signs help me prepare for potential volatility and adjust my trading strategy accordingly.
The 3 Charts I’m Watching Right Now
TOTAL – The Big Picture of Crypto Market Capitalization
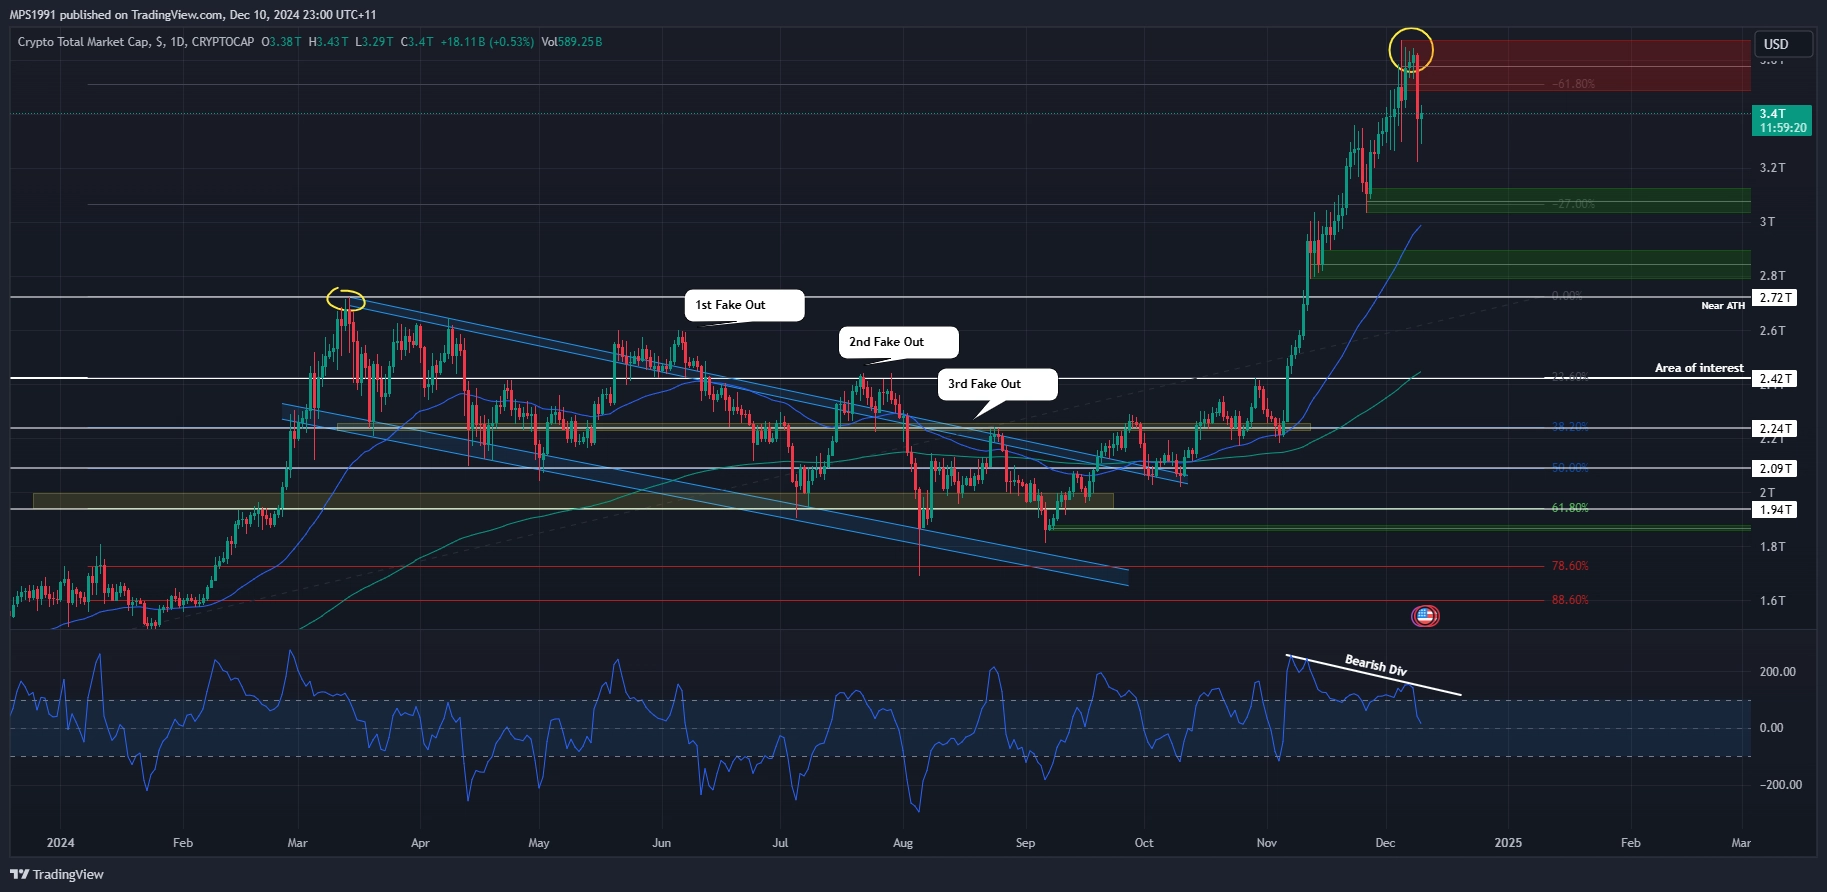
The TOTAL chart represents the overall cryptocurrency market capitalization—in simpler terms, how much money is currently in the crypto market. It’s clear that the market has had a huge run, but what many traders fail to notice, in my opinion, is the correlation across multiple charts.
On the TOTAL chart, I’m seeing it hit a pivotal point in the market: the -618 Fib extension. This aligns with a key level of resistance. Additionally, the wicks at the top of the daily candles and the bearish divergence on the CCI indicator suggest that buying pressure could be slowing down.
 Source: TradingView
USDT Dominance (USDT.D) – Following the Flow of Money
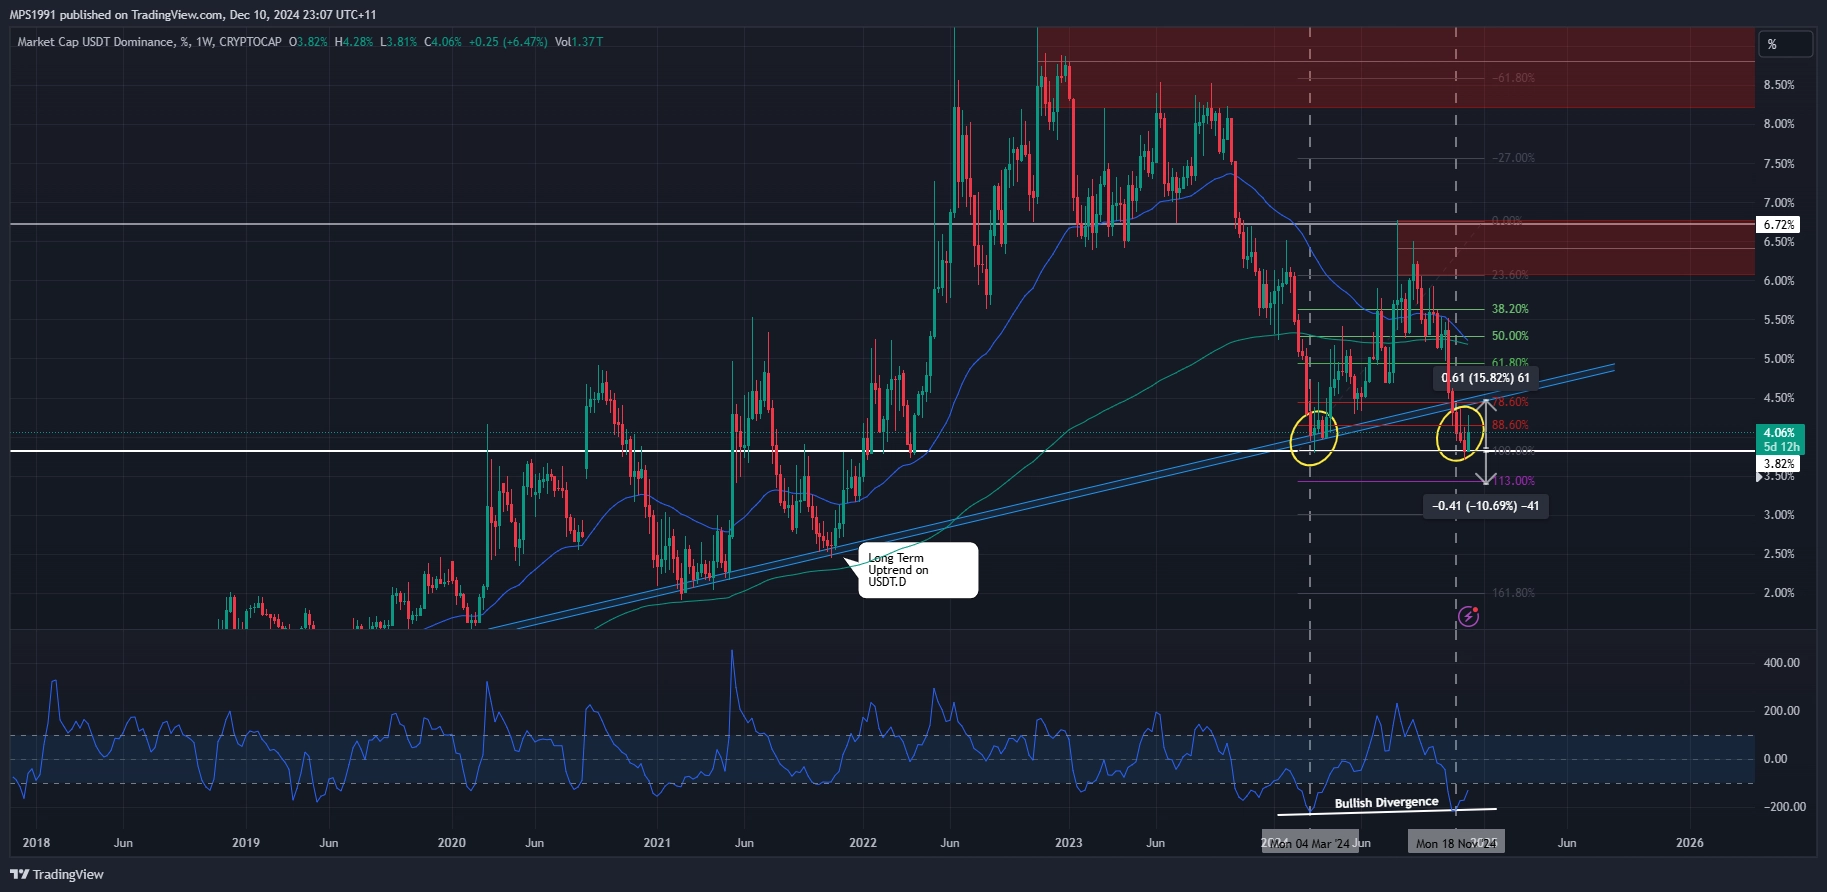
This chart shows the dominance of USDT in the market. When this chart is rising, it often means traders are converting their crypto into USDT, which can create selling pressure.
Recently, on the USDT.D chart, I noticed price bouncing off a key support level. Over the last 24 hours, I anticipated a potential push to the upside. What gave me further confidence in this prediction were bullish divergences on both the weekly and daily timeframes. This chart, combined with the TOTAL chart, adds to the confluence of signals pointing to a possible market flush.
 Source: TradingView
OTHERS – The Altcoin Market Pulse
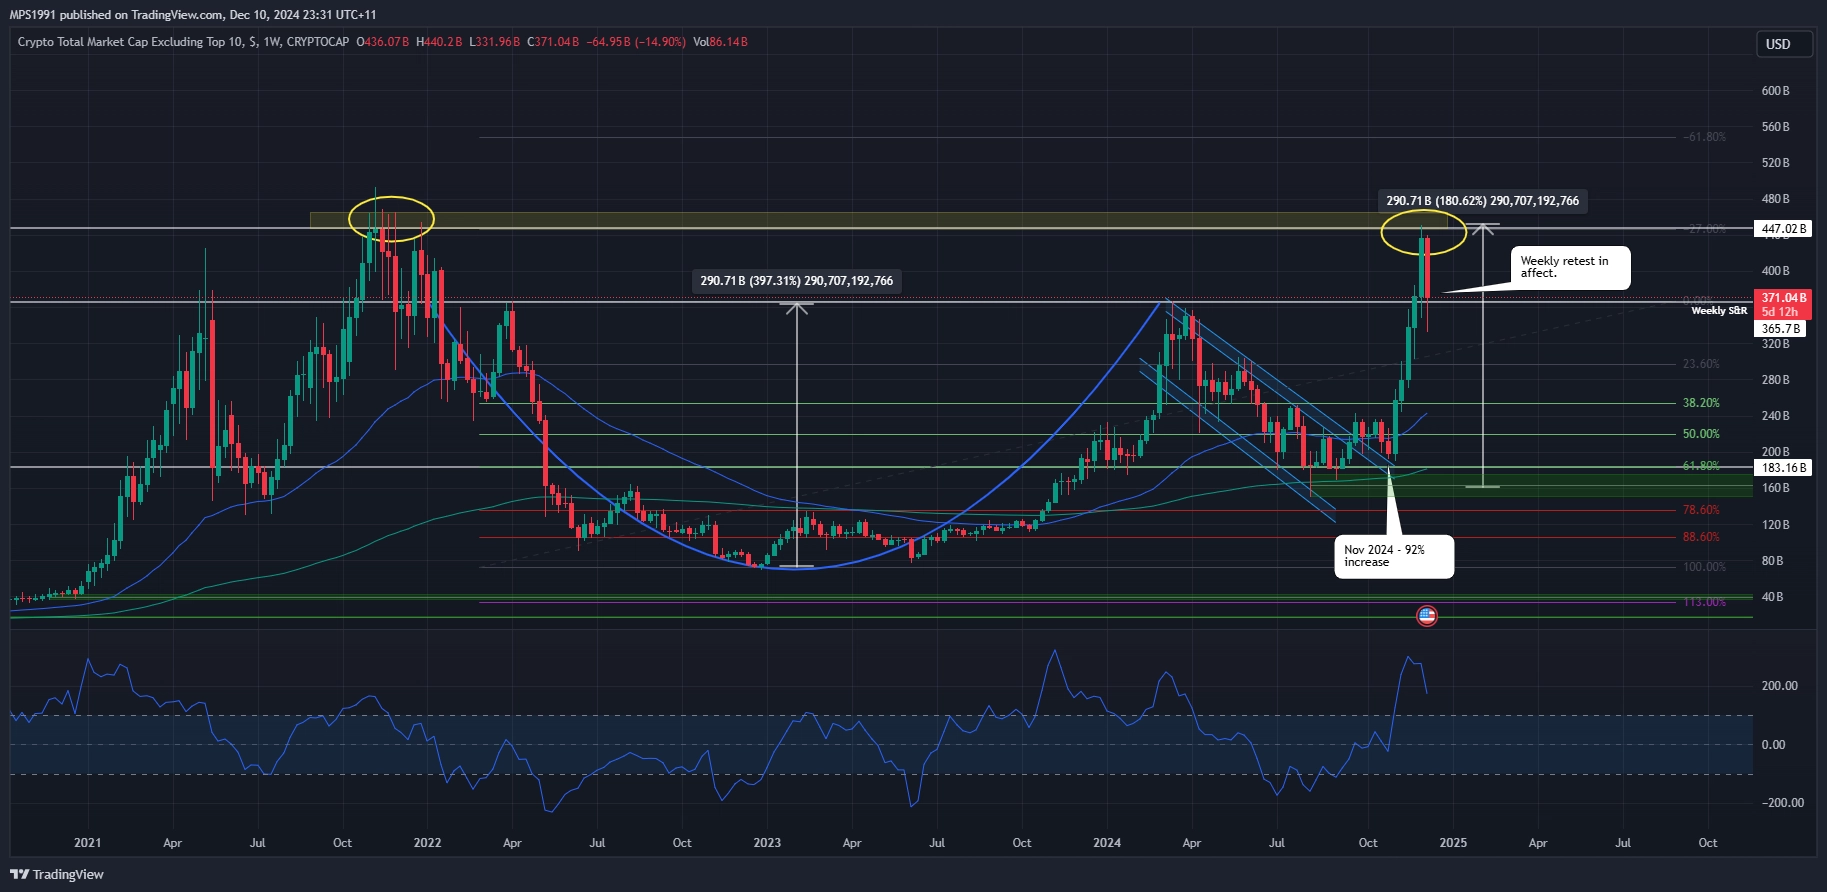
This is my go-to chart for understanding the altcoin market, excluding the top 10 tokens. Right now, I’m seeing a cup-and-handle formation that pushed 92% in November, reaching the 2021 all-time high.
However, the OTHERS chart hasn’t completely broken out yet. Instead, it’s retesting a critical weekly support level. This is something I’ll be watching very closely over the next week to see how the altcoin market evolves.
 Source: TradingView
How I Position My Portfolio During Volatile Moments
Sometimes, a good defence is just as important as a strong offense! Trading is never about guarantees—it’s about making the best decisions based on the information available to me. During volatile times, I rely on my analysis of these charts to determine how I position my portfolio. For me, it’s all about protecting what I’ve built, locking in profits where I can, and being ready to adapt to market changes.
I’ve learned over the years that staying liquid when the market feels uncertain is just as important as taking opportunities to buy when I see a setup that fits my style. This approach gives me peace of mind and helps me navigate the unpredictable nature of crypto trading.
Best of luck out there, and may the crypto gods bless your trades!
Join Empire Crypto Trading – Australia’s Ultimate Crypto Social Media and Education Platform!
Connect with passionate crypto enthusiasts and traders, access live calls, educational resources, chat groups, and ALPHA research—all in one powerful platform. See you in the Empire! community!
Written by Matthew Stella. At the time of writing this article, Bitcoin was trading at $97,350.
Disclaimer: The information provided in this article is for informational purposes only and should not be construed as financial advice. The author takes no responsibility for any financial losses incurred as a result of trading or investing based on the information provided. Always conduct your own research and consult with a professional financial advisor before making any investment decisions.


