Sand crypto tests $1 level: Retracement or breakout ahead?

![]()
Journalist
Share this article
- SAND crypto had a strongly bullish outlook in the long term.
- A bounce to $1 followed by a retracement to $0.83 is anticipated for the coming days.
The Sandbox [SAND] has gained 13.39% in the past 24 hours to become the third top gainer in the top 100 crypto assets.
The blockchain-based virtual world with the play-to-earn model could be signaling that the gaming sector tokens will be the next trend.
This is not confirmed yet, but a price move beyond $1.01 would open up the route for SAND bulls to go much, much higher. The recent rally from $0.226 to $1.06 measured 371%, taking the gaming token to a 28-month high.
Can SAND crypto continue its rally?
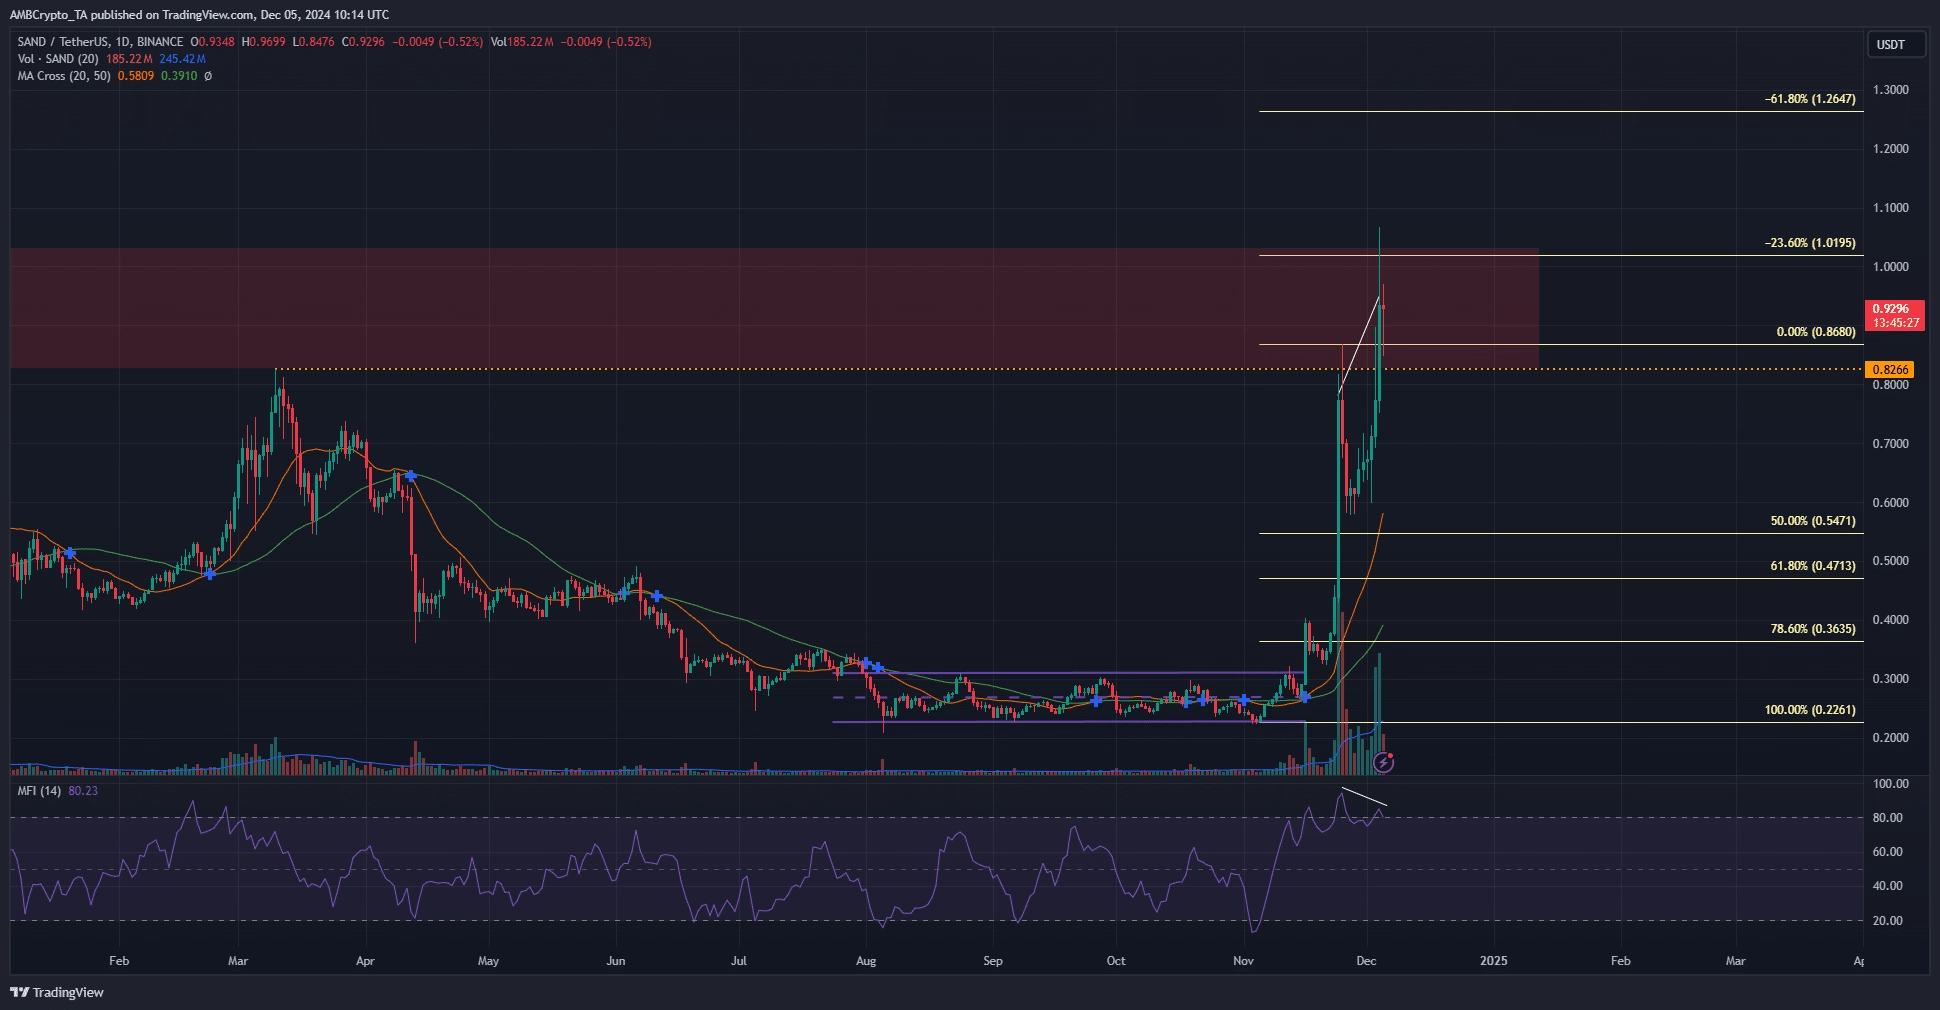
Source: SAND/USDT on TradingView
The Sandbox broke the March high at $0.8266 on the 25th of November, but the selling pressure mounted to push the bulls back. Another attempt was made over the past week and it succeeded.
A daily session close above $0.8266 was recorded on the 4th of December.
However, SAND crypto could be headed for another retracement. The $0.82-$1 region is a resistance zone from 2022 and early 2023.
Back then, amid a strong long-term downtrend, the bulls had tried hard to break this resistance zone. However, the psychological $1 level held them at bay.
At press time, SAND crypto was trading within this long-term resistance zone. Additionally, the MFI showed a bearish divergence had formed. The indicator made lower highs while the price made higher highs.
This was a warning that the capital inflows were not enough to sustain the price move higher. The next few days are likely to see a pullback toward $0.82.
Clues for short-term volatility
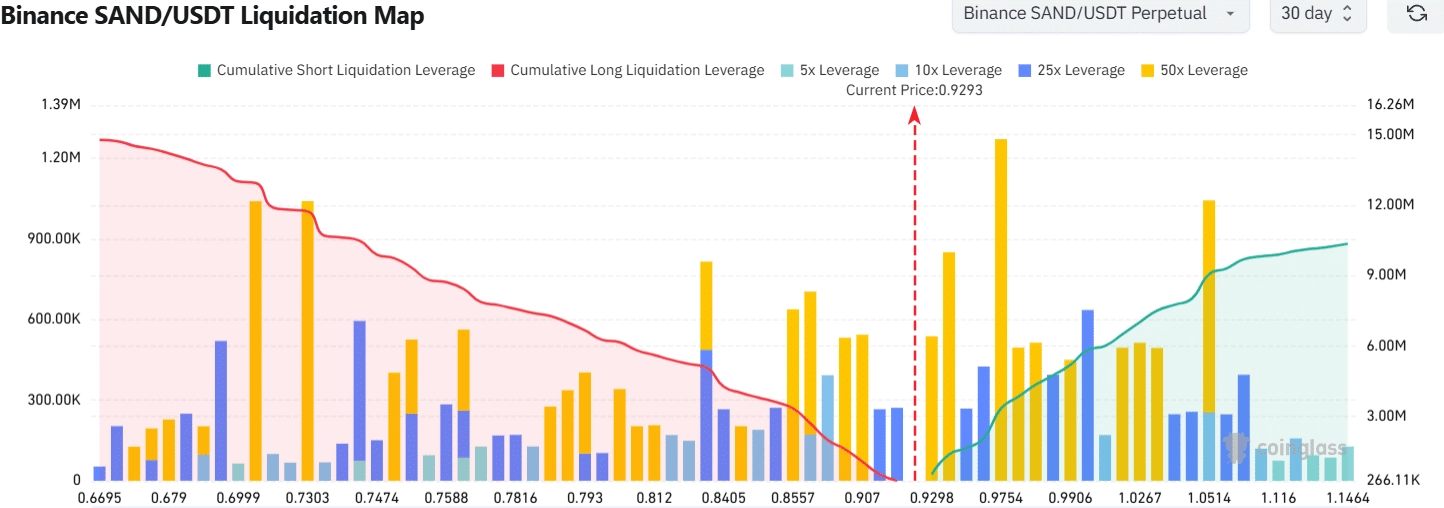
Source: Coinglass
The liquidation map showed a cluster of high-leverage short positions beneath the $1 level. The liquidity pools to the north were somewhat larger than the long liquidations that were present from $0.83 onward.
Is your portfolio green? Check the Sand Profit Calculator
This was a sign that the price could likely bounce higher to hunt the short liquidation levels before falling toward $0.83. This situation does not guarantee a bounce to $0.99, so traders should prepare for that scenario.
As things stand, a move beyond $1 appeared unlikely in the short term.
Disclaimer: The information presented does not constitute financial, investment, trading, or other types of advice and is solely the writer’s opinion
Share