What’s Next For BTC, ETH, BNB, SOL, And XRP As Crypto Market Stumbles!
With a bearish start to the month and the price of Bitcoin dropping below the $55,000 mark, the cryptocurrency market has continued to display a mixed price action this week.
Following this, top altcoins have recorded a similar price action by recording a constant pump-and-dump-like situation. With the current market situation, is this the right time to stack more tokens for the upcoming crypto bull run?
Let’s take a look at the market sentiments, price analysis, and potential price targets of the top 5 cryptocurrencies by market capitalization.
Bitcoin (BTC):
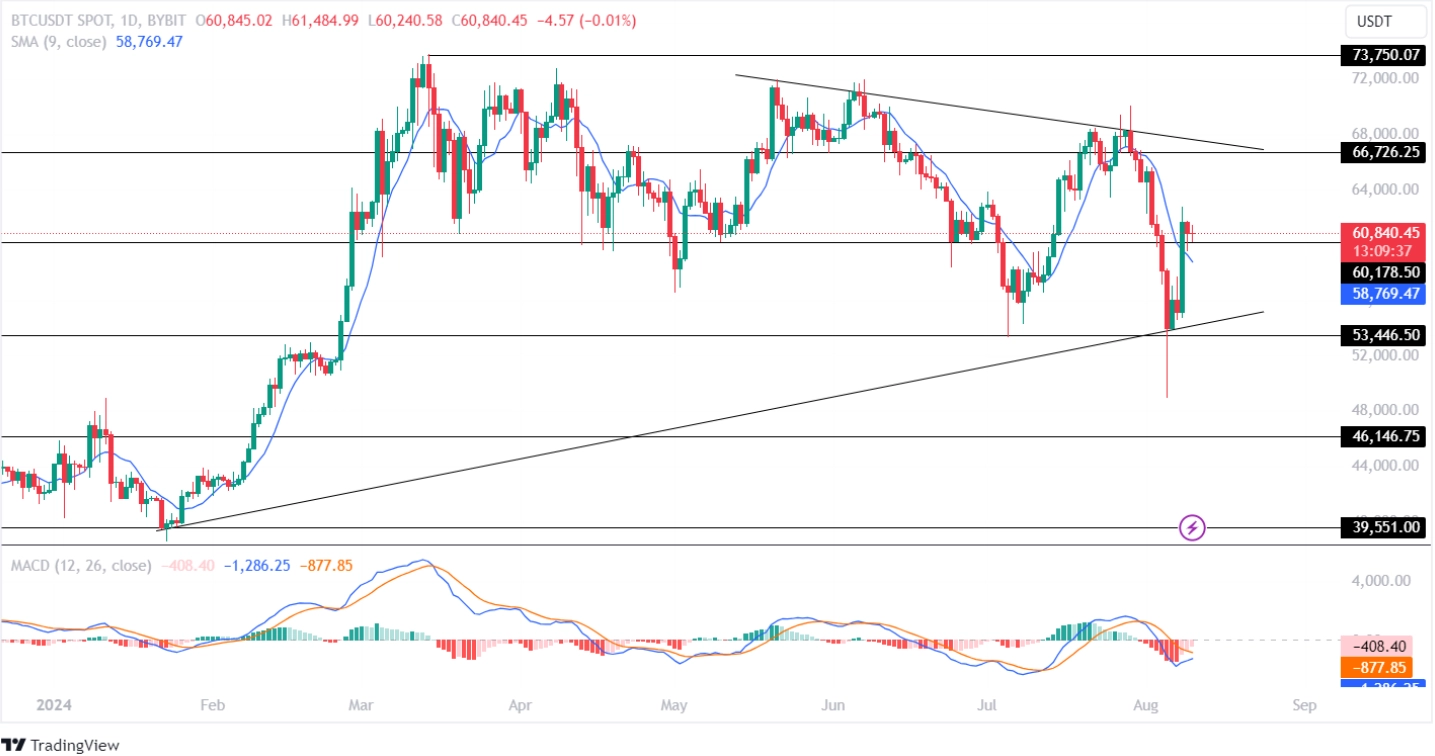
The Bitcoin price continues to hold its value above the $60,000 mark with a jump of approximately 1% within the past 24 hours and a trading volume of $24.307 Billion. Despite losing 2.37% within the past week, it has surged 43.16% this year alone, indicating a long-term bullish sentiment.
 TradingView: BTC/USDT
 The Moving Average Convergence Divergence (MACD) has recorded a constant rise in the histogram with its averages showing a potential bullish convergence in the 1D time frame. This highlights an increase in the buying-over-selling pressure.
If the market holds the BTC price above its support level of $60,178, the bulls will prepare to test its resistance level of $66,726 this month. Conversely, if the bears regain momentum, the price of Bitcoin will retest its low of $55,000.
Ethereum (ETH):
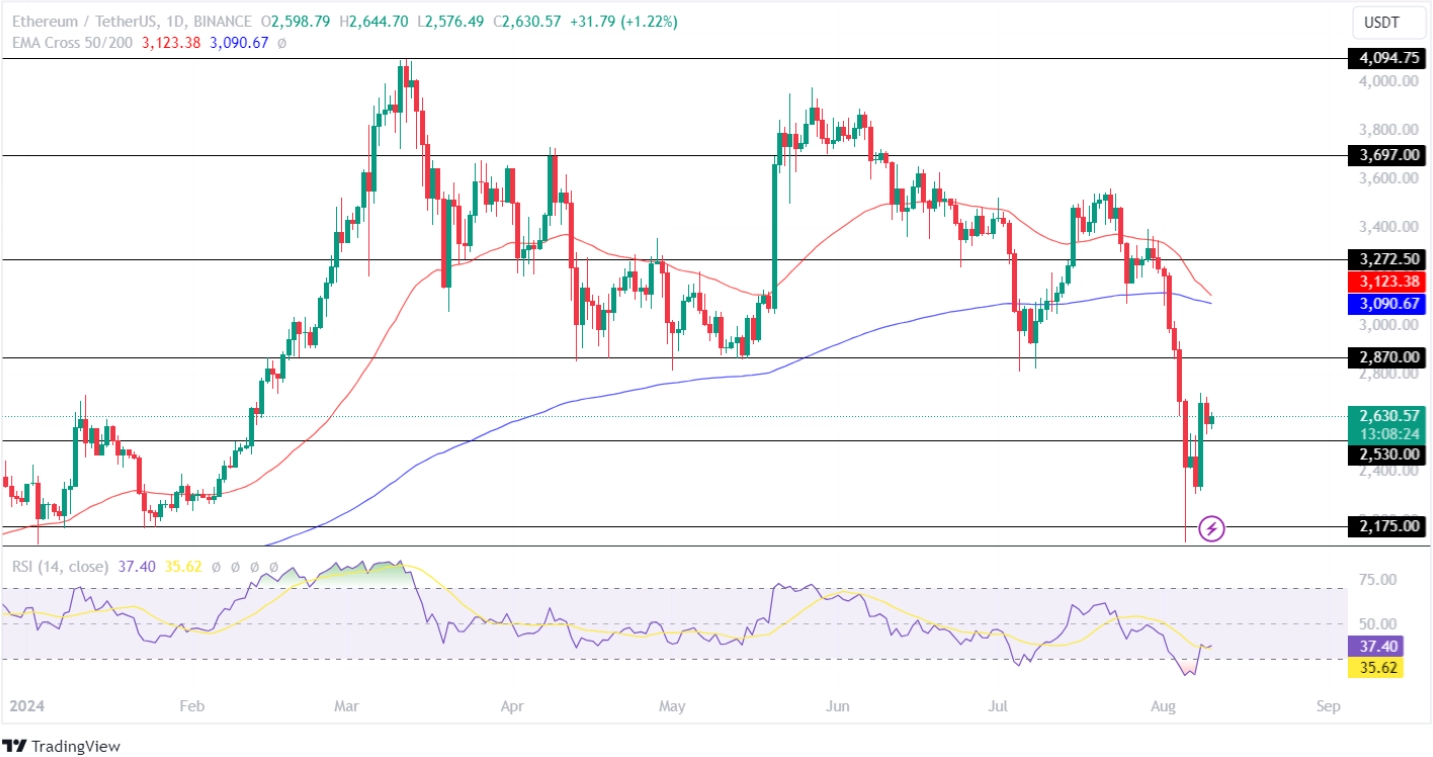
Following in the footsteps, the Ethereum price has recorded a similar price action by holding its value above its important support level of $2,500. Notably, the altcoin leader a constantly displayed a negative price action over the past month, indicating a rising disinterest in investors.
 TradingView: ETH/USDT
 The RSI indicator has displayed increased bullish action by recording a sharp uptrend below its oversold range. On the other hand, the EMA 50/200-day shows a potential Death Cross, suggesting a mixed sentiment for the Ethereum price in the crypto market.
Suppose, the bulls regain momentum, in that case, the ETH coin price will prepare to test its upper resistance level of $3,300 in the coming time. However, a bearish action could pull the ETH price toward its low of $2,200.
Binance (BNB):
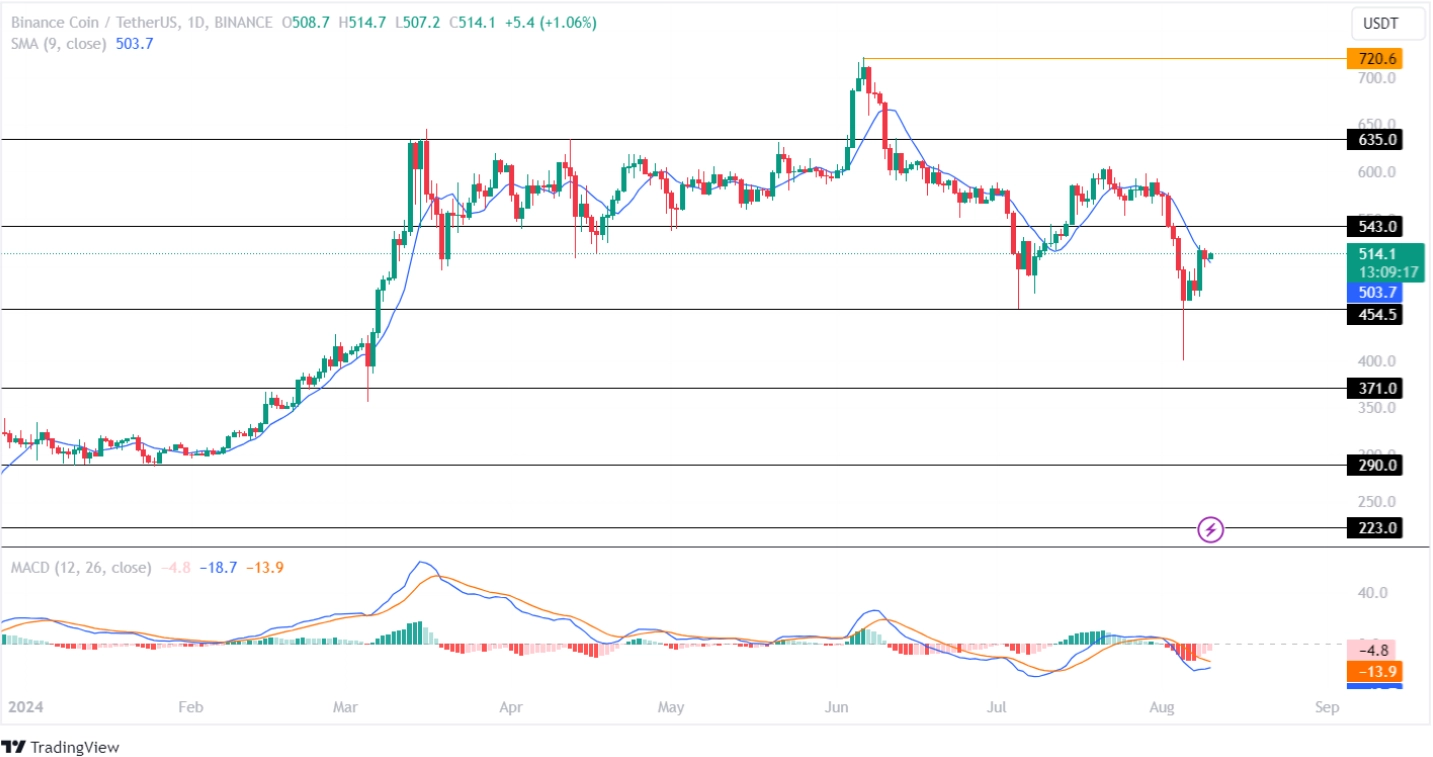
With a jump of 1.59% over the past 24 hours, the Binance price has successfully held its position as the 4th largest cryptocurrency in the market with a market capitalization of $74.870 Billion. Despite recording a neutral price action since March, it has rewarded its investors with a 65.6% YTD return.
 TradingView: BNB/USDT
 The Simple Moving Average (SMA) is on the verge of recording a positive crossover in the Binance price chart. Furthermore, the MACD shows a similar price action, suggesting that the BNB price will continue gaining value in the coming time.
If the market pushes the BNB coin price above its resistance level of $543, the bulls will head toward its upper resistance level of $635 during the upcoming weeks. Negatively, if a trend reversal occurs, the BNB crypto will drop toward its crucial support level of $454.5.
Solana (SOL):
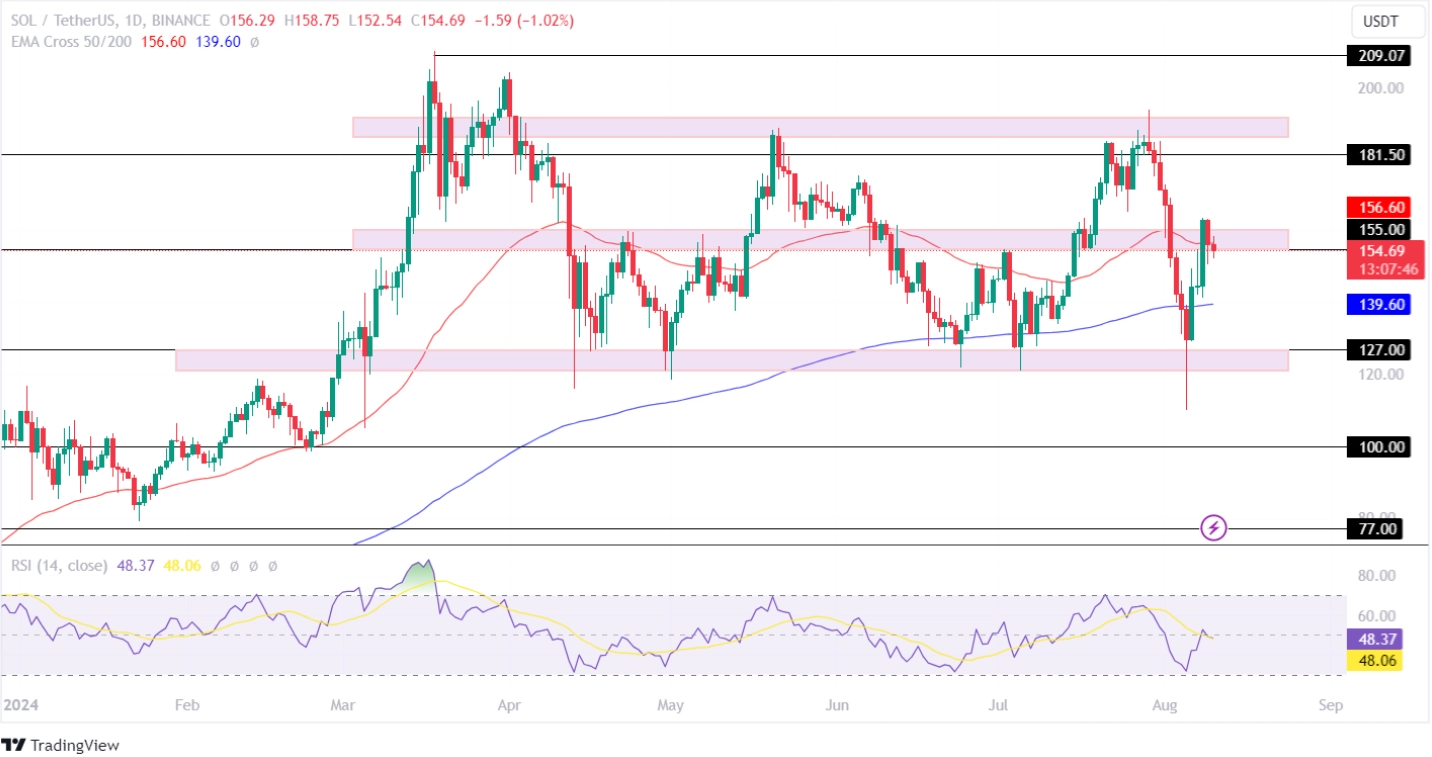
In spite of increased buying-and-selling pressure in the crypto market, the Solana price has failed to surpass its important resistance level of $181. Currently, the altcoin is hovering close to its $155 mark and is on the verge of testing its support level, the outcome of which is uncertain.
 TradingView: SOL/USDT
 The Relative Strength Index (RSI) had successfully retested its oversold range, following which it surged toward its neutral point. However, since then it has been hovering close to it, suggesting uncertainty in the future price action of this altcoin.
If the market holds its value above its important support level of $155, the SOL price will retest its upper resistance of $181. Conversely, if the bears dominate the crypto market, the Solana price could plunge toward its low of $127.
Ripple (XRP):
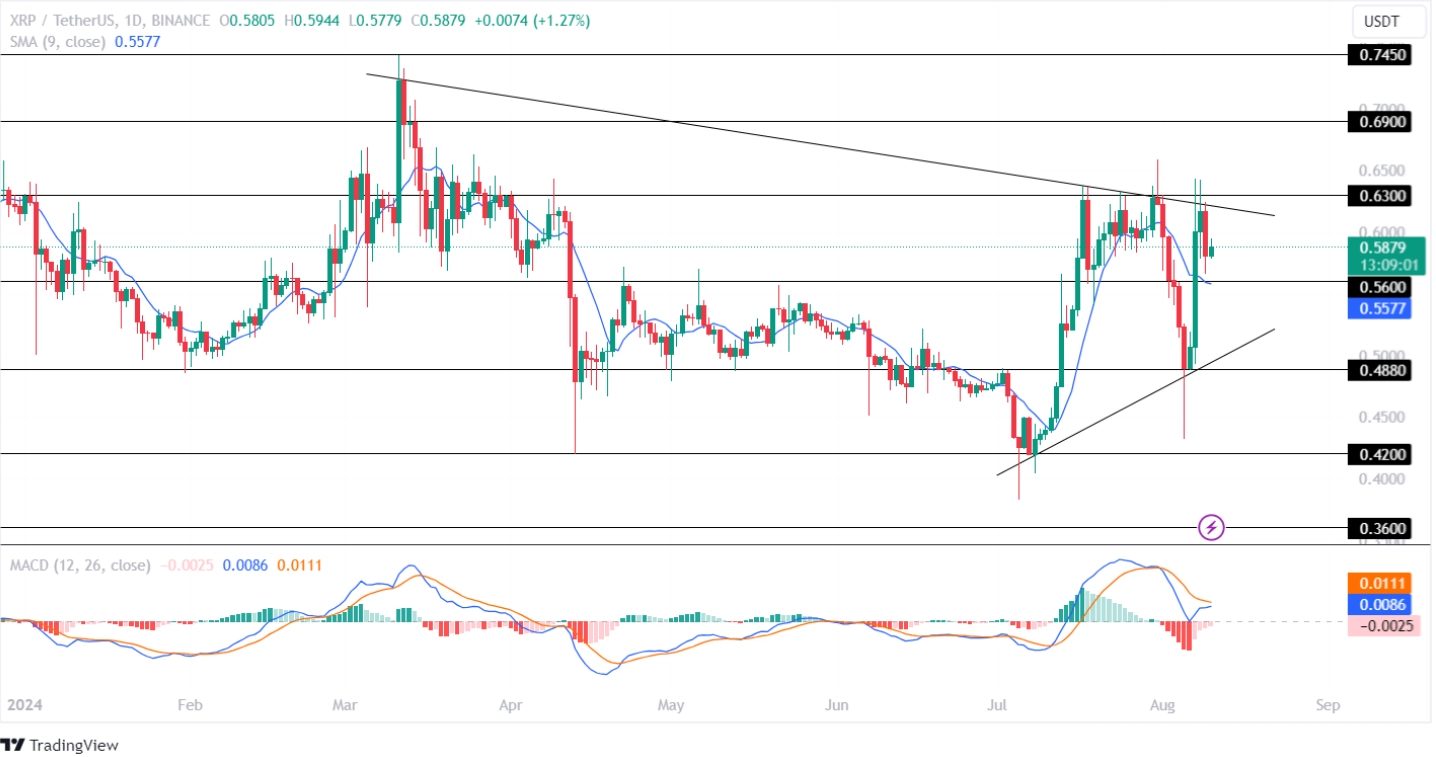
The XRP price continues trading under a bullish sentiment by adding approximately 3% within the past day and 4.36% over the past seven days. Furthermore, the Ripple token has jumped 31.36% over the past 30 days and has secured the 7th position in the global crypto-list with a market cap of $33.48 Billion.
 TradingView: XRP/USDT
 The RSI shows a constant decline in the red histogram, highlighting an increase in the buying pressure. However, the averages display a neutral trend, suggesting a mixed sentiment in the crypto market.
If the market continues trading under a bullish sentiment, the Ripple price will break out of its resistance trendline and head toward its upper high of $0.69. However, a negative action could result in it retesting its low of $0.488.

